

Kava price prediction: Buyers firmly control session as rally tests $0.0746 resistance

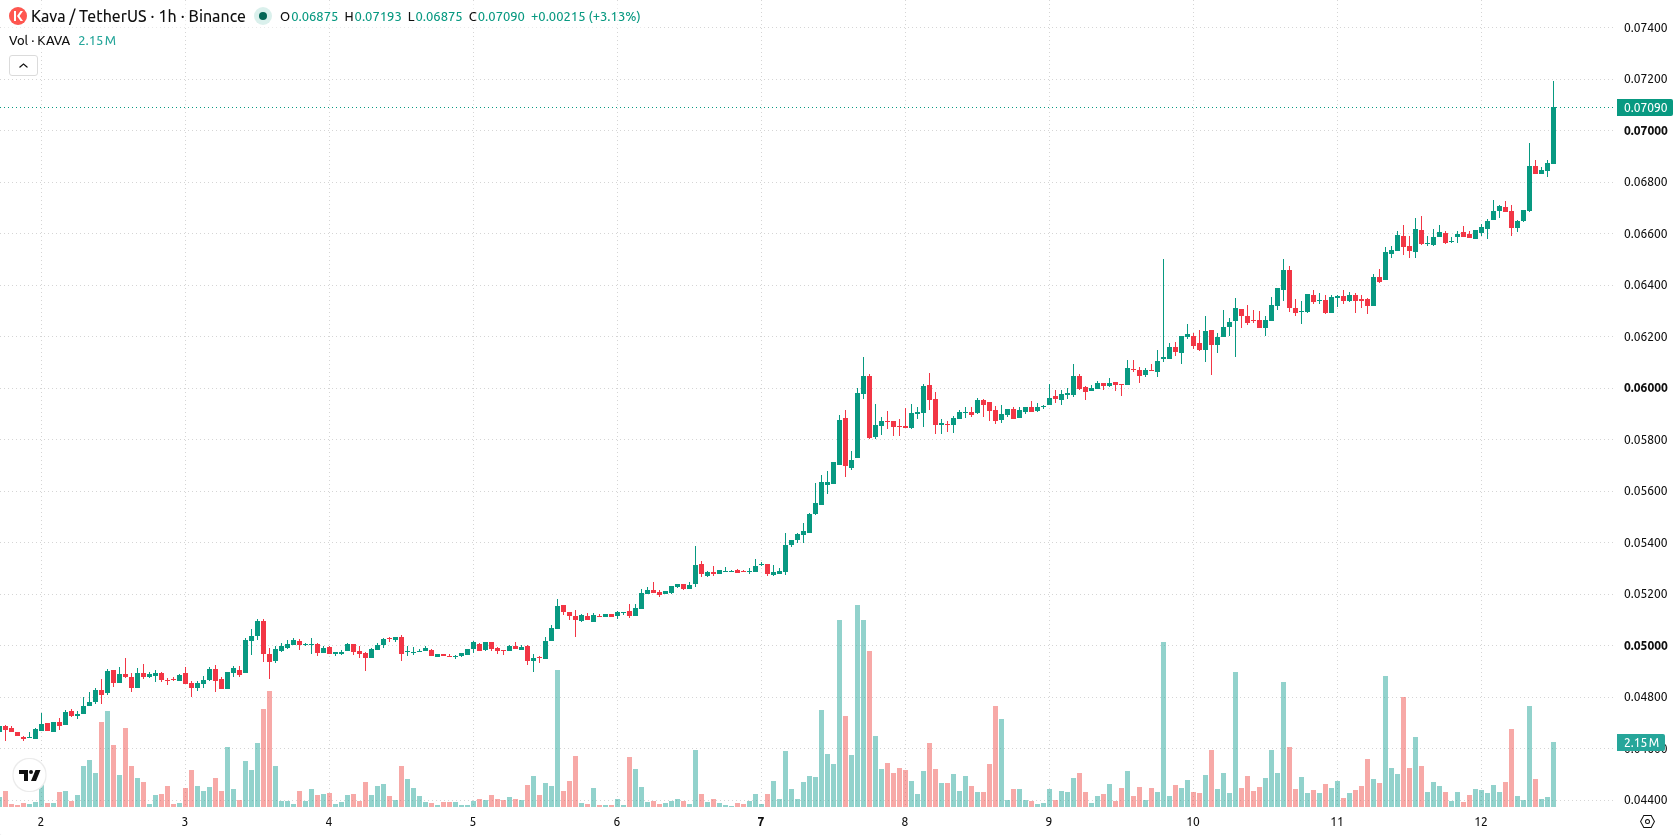
Kava (KAVA) is trading at $0.0711, up 8.64% on the session. The cryptocurrency sits above its key moving averages, with buyers maintaining clear control over the short-term trend.
 0.0271
0.0387
Highlights
- KAVA/USD continues to show strong bullish momentum on all major timeframes, currently trading well above key moving averages.
- Short-term technical indicators reveal positive momentum, but several oscillators are now in overbought territory, suggesting the potential for resistance.
- Price is projected to fluctuate within the $0.0676 to $0.0746 range over the next two to three days, with a breakout above this corridor likely to extend gains.
Momentum divergence emerges as technical signals conflict
The MA-20 and MA-50 are positioned below the current price, with the MA-200 remaining well below both, confirming a strong separation among all major averages. Immediate support is established by the Ichimoku Kijun at $0.0673. Momentum indicators show MACD and ADX remain bullish, while the RSI stands at 68.98, supporting a buy signal. However, the CCI indicates overbought conditions, and Stoch RSI signals a strong sell, highlighting the risk of a corrective move. Bull/Bear Power readings confirm session-long buyer dominance, and the Awesome Oscillator echoes the prevailing uptrend.
Sideways trade expected as key price thresholds converge
Over the next 2–3 sessions, KAVA is anticipated to trade within a volatility band of $0.0676 to $0.0746. The baseline scenario involves sideways movement inside this corridor. If the price breaks out above $0.0746, bullish momentum could accelerate, leading to fresh short-term highs. A move below the $0.0673 support (Ichimoku Kijun) would indicate a bearish reversal, potentially opening further downside in the near term.
Earlier, analysts noted that Kava was experiencing strong short-term momentum along with signs of potential overbought conditions and divergence among technical indicators. The current analysis builds on this view, highlighting that continued bullish momentum now faces heightened risk of a corrective pullback if support at $0.0673 fails to hold.









-
 Afghanistan
-
 Albania
-
 Algeria
-
 Angola
-
 Argentina
-
 Armenia
-
 Australia
-
 Austria
-
 Azerbaijan
-
 Bahamas
-
 Bahrain
-
 Bangladesh
-
 Belarus
-
 Belgium
-
 Bolivia
-
 Botswana
-
 Brazil
-
 Brunei
-
 Bulgaria
-
 Cambodia
-
 Cameroon
-
 Canada
-
 Chile
-
 China
-
 Colombia
-
 Congo
-
 Costa Rica
-
 Cote d'Ivoire
-
 Croatia
-
 Cuba
-
 Cyprus
-
 Czechia
-
 DR Congo
-
 Denmark
-
 Dominican Republic
-
 Ecuador
-
 Egypt
-
 El Salvador
-
 Estonia
-
 Eswatini
-
 Ethiopia
-
 Finland
-
 France
-
 Georgia
-
 Germany
-
 Ghana
-
 Greece
-
 Haiti
-
 Hong Kong
-
 Hungary
-
 India
-
 Indonesia
-
 Iran, Islamic republic
-
 Iraq
-
 Ireland
-
 Israel
-
 Italy
-
 Jamaica
-
 Japan
-
 Jordan
-
 Kazakhstan
-
 Kenya
-
 Korea
-
 Kuwait
-
 Kyrgyzstan
-
 Laos
-
 Latvia
-
 Lebanon
-
 Lesotho
-
 Libya
-
 Lithuania
-
 Luxembourg
-
 Madagascar
-
 Malaysia
-
 Malta
-
 Mauritius
-
 Mexico
-
 Moldova
-
 Mongolia
-
 Montenegro
-
 Morocco
-
 Mozambique
-
 Myanmar
-
 Namibia
-
 Nepal
-
 Netherlands
-
 New Zealand
-
 Nigeria
-
 North Macedonia
-
 Norway
-
 Oman
-
 Pakistan
-
 Palestine
-
 Panama
-
 Papua New Guinea
-
 Paraguay
-
 Peru
-
 Philippines
-
 Poland
-
 Portugal
-
 Puerto Rico
-
 Qatar
-
 Reunion
-
 Romania
-
 Rwanda
-
 Saudi Arabia
-
 Serbia
-
 Singapore
-
 Slovakia
-
 Slovenia
-
 Somalia
-
 South Africa
-
 Spain
-
 Sri Lanka
-
 Sweden
-
 Switzerland
-
 Syria
-
 Taiwan
-
 Tajikistan
-
 Tanzania
-
 Thailand
-
 Trinidad and Tobago
-
 Tunisia
-
 Turkey
-
 UAE
-
 Uganda
-
 Ukraine
-
 United Kingdom
-
United States
-
 Uruguay
-
 Uzbekistan
-
 Venezuela
-
 Vietnam
-
 Yemen
-
 Zambia
-
 Zimbabwe
- Forex
- Crypto












