

Kava technical analysis: Downward price move persists as sellers remain in control

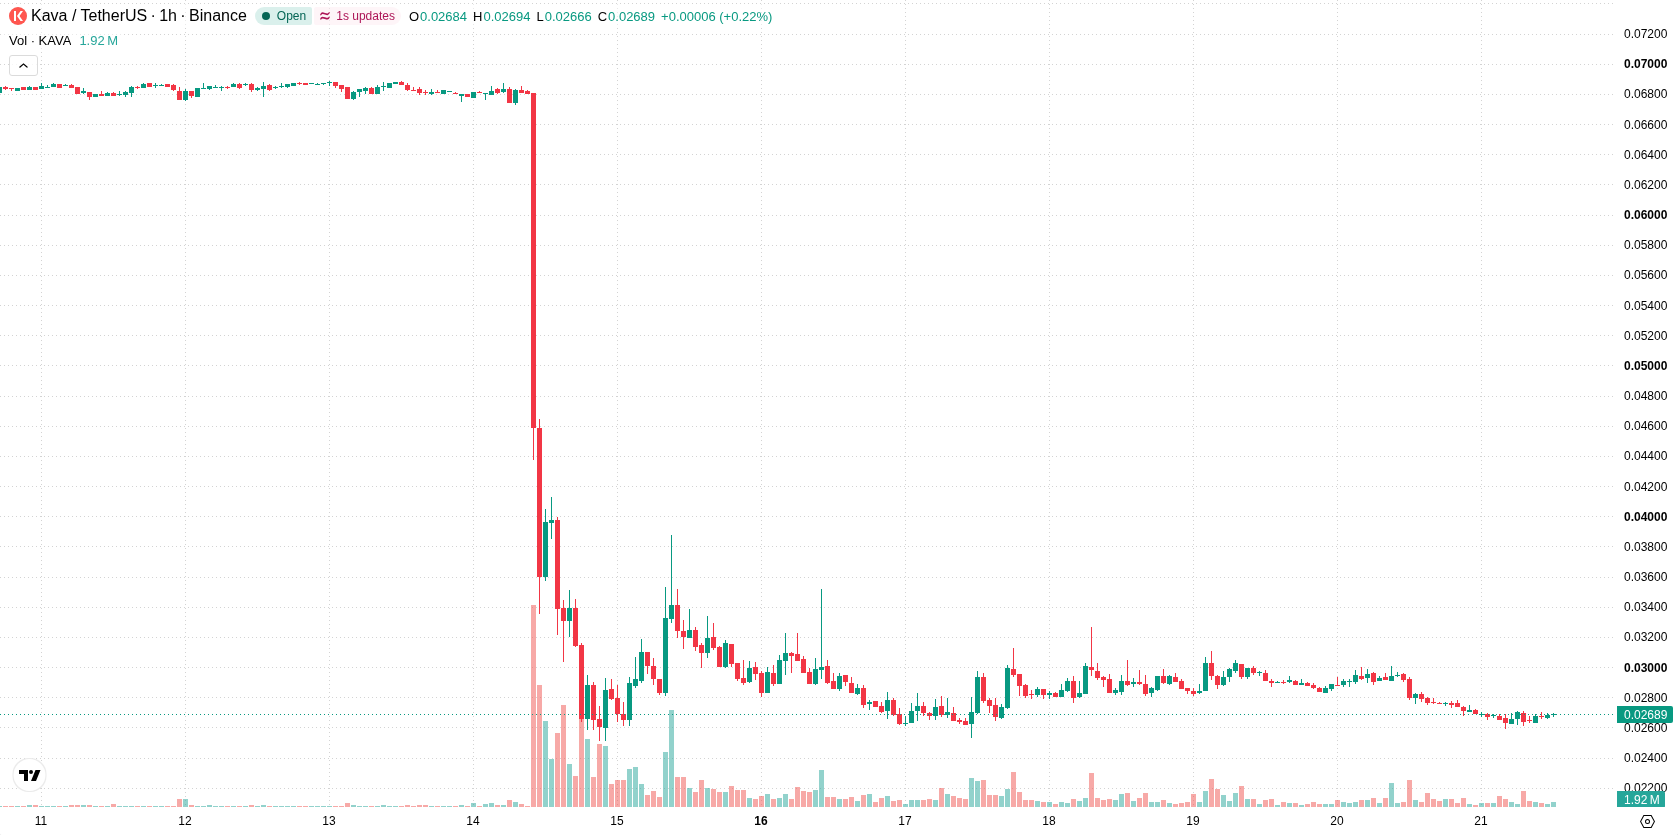
Kava (KAVA) is trading at $0.0268 after sliding 7.03% over the last 24 hours. The asset remains under pressure, currently positioned below its key moving averages, as sellers control the near-term price action.
 0.0271
0.0387
Highlights
- Kava Lend experienced a major exploit in its BUSD market, allowing an attacker to extract 55 million KAVA worth $3.76 million.
- The exploit increased token circulation, rapidly raising operational risk and ecosystem trust concerns while Kava initiated an urgent investigation.
- KAVA/USD trades below key moving averages and momentum remains bearish, with a 2 to 3 day range forecast of $0.0032 to $0.0298.
Market confidence falters as major hack expands token supply
On November 14, 2026, Kava Chain’s lending protocol Kava Lend was exploited when an attacker manipulated the BUSD market, dramatically raising the supply interest index and extracting roughly 55 million KAVA—valued at $3.76 million before the event—then converting most funds via BNB Chain, according to Wublock Substack. This incident instantly expanded token circulation and raised operational risk, putting significant pressure on ecosystem trust and liquidity. Kava has responded by initiating a high-priority investigation into irregular dApp behaviour within its ecosystem, also reported by Wublock Substack, underlining continued uncertainty and governance questions.
Bearish momentum sustained as resistance and negative signals prevail
On the technical side, KAVA/USD remains below the H1 SMA-20 at $0.027, the H1 SMA-50 at $0.0282, and the D1 SMA-200 at $0.0543. Immediate resistance is established by the Ichimoku Kijun at $0.0278, effectively limiting upward moves. MACD flashes a strong sell signal, while ADX is in sell territory with no evidence of trend exhaustion. The RSI and CCI both read neutral, but Stoch RSI is overbought, painting a mixed picture. Bull/Bear Power is slightly negative, showing seller dominance in the short term, while the Awesome Oscillator registers as neutral.
Further decline favored as volatility persists and resistance caps upside
Looking ahead to the next 2–3 trading days, the likely price range for KAVA/USD falls between $0.0032 and $0.0298, in line with its typical volatility. Current probabilities favor a 75% chance of a further down move and only a 25% chance of short-term recovery, with consolidation within this band as the baseline scenario. A sustained bullish breakout would require the price to decisively clear the $0.0278 resistance, while failure to hold support near the lower range may result in a deeper decline.
Earlier, analysts noted that Kava remained under persistent selling pressure following the November protocol exploit, with downside risks elevated amid weak technical structure. The latest price action and technical readings reinforce these bearish conditions, underscoring the importance of monitoring the $0.0278 resistance and lower support for signs of a potential breakdown or reversal in the coming sessions.









-
 Afghanistan
-
 Albania
-
 Algeria
-
 Angola
-
 Argentina
-
 Armenia
-
 Australia
-
 Austria
-
 Azerbaijan
-
 Bahamas
-
 Bahrain
-
 Bangladesh
-
 Belarus
-
 Belgium
-
 Bolivia
-
 Botswana
-
 Brazil
-
 Brunei
-
 Bulgaria
-
 Cambodia
-
 Cameroon
-
 Canada
-
 Chile
-
 China
-
 Colombia
-
 Congo
-
 Costa Rica
-
 Cote d'Ivoire
-
 Croatia
-
 Cuba
-
 Cyprus
-
 Czechia
-
 DR Congo
-
 Denmark
-
 Dominican Republic
-
 Ecuador
-
 Egypt
-
 El Salvador
-
 Estonia
-
 Eswatini
-
 Ethiopia
-
 Finland
-
 France
-
 Georgia
-
 Germany
-
 Ghana
-
 Greece
-
 Haiti
-
 Hong Kong
-
 Hungary
-
 India
-
 Indonesia
-
 Iran, Islamic republic
-
 Iraq
-
 Ireland
-
 Israel
-
 Italy
-
 Jamaica
-
 Japan
-
 Jordan
-
 Kazakhstan
-
 Kenya
-
 Korea
-
 Kuwait
-
 Kyrgyzstan
-
 Laos
-
 Latvia
-
 Lebanon
-
 Lesotho
-
 Libya
-
 Lithuania
-
 Luxembourg
-
 Madagascar
-
 Malaysia
-
 Malta
-
 Mauritius
-
 Mexico
-
 Moldova
-
 Mongolia
-
 Montenegro
-
 Morocco
-
 Mozambique
-
 Myanmar
-
 Namibia
-
 Nepal
-
 Netherlands
-
 New Zealand
-
 Nigeria
-
 North Macedonia
-
 Norway
-
 Oman
-
 Pakistan
-
 Palestine
-
 Panama
-
 Papua New Guinea
-
 Paraguay
-
 Peru
-
 Philippines
-
 Poland
-
 Portugal
-
 Puerto Rico
-
 Qatar
-
 Reunion
-
 Romania
-
 Rwanda
-
 Saudi Arabia
-
 Serbia
-
 Singapore
-
 Slovakia
-
 Slovenia
-
 Somalia
-
 South Africa
-
 Spain
-
 Sri Lanka
-
 Sweden
-
 Switzerland
-
 Syria
-
 Taiwan
-
 Tajikistan
-
 Tanzania
-
 Thailand
-
 Trinidad and Tobago
-
 Tunisia
-
 Turkey
-
 UAE
-
 Uganda
-
 Ukraine
-
 United Kingdom
-
United States
-
 Uruguay
-
 Uzbekistan
-
 Venezuela
-
 Vietnam
-
 Yemen
-
 Zambia
-
 Zimbabwe
- Forex
- Crypto












