

Will KAVA avoid deeper losses amid lingering fallout from protocol exploit?

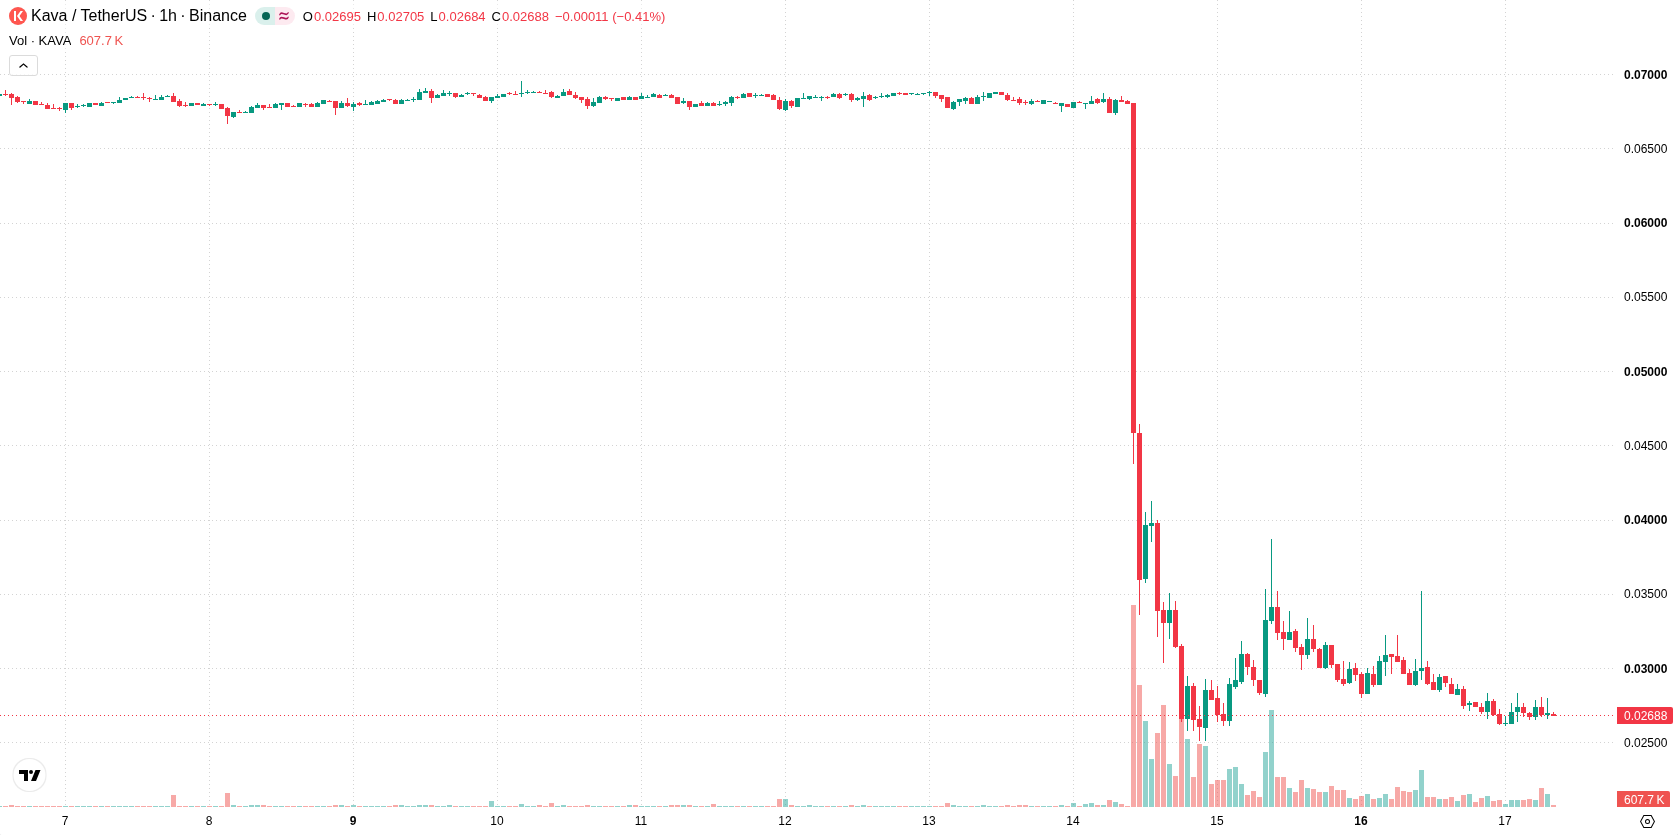
Kava (KAVA) is trading at $0.0269, down 9.58% for the day. The asset remains below its key moving averages, indicating ongoing downside pressure relative to recent trends.
 0.0283
0.0689
Highlights
- Attackers exploited Kava's HARD Lend protocol on November 14, 2026, siphoning approximately 53.9 million KAVA tokens through manipulation of a dormant BUSD collateral market.
- Kava responded by patching the vulnerability, adding new safeguards, and initiating a seven-day vote on suspending new lending, with exchanges like Upbit and Bithumb placing KAVA on watchlists for possible delisting.
- KAVA trades below major moving averages with persistent selling pressure and high volatility, with the expected range set at $0.0215 to $0.0323 and low probability of an upside move.
Liquidity crisis deepens after exploit triggers exchange delisting threats
On November 14, 2026, the Kava blockchain experienced a major exploit on its HARD Lend protocol, where attackers manipulated the accounting of a dormant BUSD collateral market and managed to borrow approximately 53.9 million KAVA tokens. This incident created a substantial liquidity shortfall and led to immediate responses from Kava, including patching the vulnerability, implementing new safeguards, and initiating a seven-day governance vote to consider shutting down new lending on the platform. Multiple exchanges, such as Upbit and Bithumb, subsequently placed KAVA on their delisting watchlists in reaction to the confirmed exploit, according to Kucoin.
Sustained selling pressure as bearish signals clash with neutral momentum
KAVA/USD is trading below H1 SMA-20 at $0.0275, below H1 SMA-50 at $0.0293, and below D1 SMA-200 at $0.055. The immediate resistance is marked by the Ichimoku Kijun level at $0.0306. MACD signals Strong Sell, while ADX is Neutral. RSI, Stochastic RSI, and CCI all indicate neutral zones, reflecting an absence of overbought or oversold conditions. Bull/Bear Power is negative at -0.0002, showing slight intraday seller dominance, and the Awesome Oscillator is neutral. These factors together point to persistent selling pressure, but oscillators suggest direction remains mixed in the near term.
Downside risk dominates as volatility bands define outlook
Over the coming days, KAVA is expected to hold within a typical volatility range of $0.0215 to $0.0323. The probability of a downward move is considerably higher than an upward recovery in the short term. If KAVA breaks above the $0.0306 resistance, further upside could be triggered. However, a move below the $0.0215 support would expose the pair to additional downside risk.
Earlier, analysts noted that Kava faced continued bearish momentum and technical weakness following a major protocol exploit and liquidity crisis. The latest data reinforces the prevailing downside scenario, with KAVA now vulnerable to additional losses if the $0.0215 support level fails to hold in the days ahead.






Latest Kava News



-
 Afghanistan
-
 Albania
-
 Algeria
-
 Angola
-
 Argentina
-
 Armenia
-
 Australia
-
 Austria
-
 Azerbaijan
-
 Bahamas
-
 Bahrain
-
 Bangladesh
-
 Belarus
-
 Belgium
-
 Bolivia
-
 Botswana
-
 Brazil
-
 Brunei
-
 Bulgaria
-
 Cambodia
-
 Cameroon
-
 Canada
-
 Chile
-
 China
-
 Colombia
-
 Congo
-
 Costa Rica
-
 Cote d'Ivoire
-
 Croatia
-
 Cuba
-
 Cyprus
-
 Czechia
-
 DR Congo
-
 Denmark
-
 Dominican Republic
-
 Ecuador
-
 Egypt
-
 El Salvador
-
 Estonia
-
 Eswatini
-
 Ethiopia
-
 Finland
-
 France
-
 Georgia
-
 Germany
-
 Ghana
-
 Greece
-
 Haiti
-
 Hong Kong
-
 Hungary
-
 India
-
 Indonesia
-
 Iran, Islamic republic
-
 Iraq
-
 Ireland
-
 Israel
-
 Italy
-
 Jamaica
-
 Japan
-
 Jordan
-
 Kazakhstan
-
 Kenya
-
 Korea
-
 Kuwait
-
 Kyrgyzstan
-
 Laos
-
 Latvia
-
 Lebanon
-
 Lesotho
-
 Libya
-
 Lithuania
-
 Luxembourg
-
 Madagascar
-
 Malaysia
-
 Malta
-
 Mauritius
-
 Mexico
-
 Moldova
-
 Mongolia
-
 Montenegro
-
 Morocco
-
 Mozambique
-
 Myanmar
-
 Namibia
-
 Nepal
-
 Netherlands
-
 New Zealand
-
 Nigeria
-
 North Macedonia
-
 Norway
-
 Oman
-
 Pakistan
-
 Palestine
-
 Panama
-
 Papua New Guinea
-
 Paraguay
-
 Peru
-
 Philippines
-
 Poland
-
 Portugal
-
 Puerto Rico
-
 Qatar
-
 Reunion
-
 Romania
-
 Rwanda
-
 Saudi Arabia
-
 Serbia
-
 Singapore
-
 Slovakia
-
 Slovenia
-
 Somalia
-
 South Africa
-
 Spain
-
 Sri Lanka
-
 Sweden
-
 Switzerland
-
 Syria
-
 Taiwan
-
 Tajikistan
-
 Tanzania
-
 Thailand
-
 Trinidad and Tobago
-
 Tunisia
-
 Turkey
-
 UAE
-
 Uganda
-
 Ukraine
-
 United Kingdom
-
United States
-
 Uruguay
-
 Uzbekistan
-
 Venezuela
-
 Vietnam
-
 Yemen
-
 Zambia
-
 Zimbabwe
- Forex
- Crypto












