

XTZ drops as sellers dominate across all timeframes

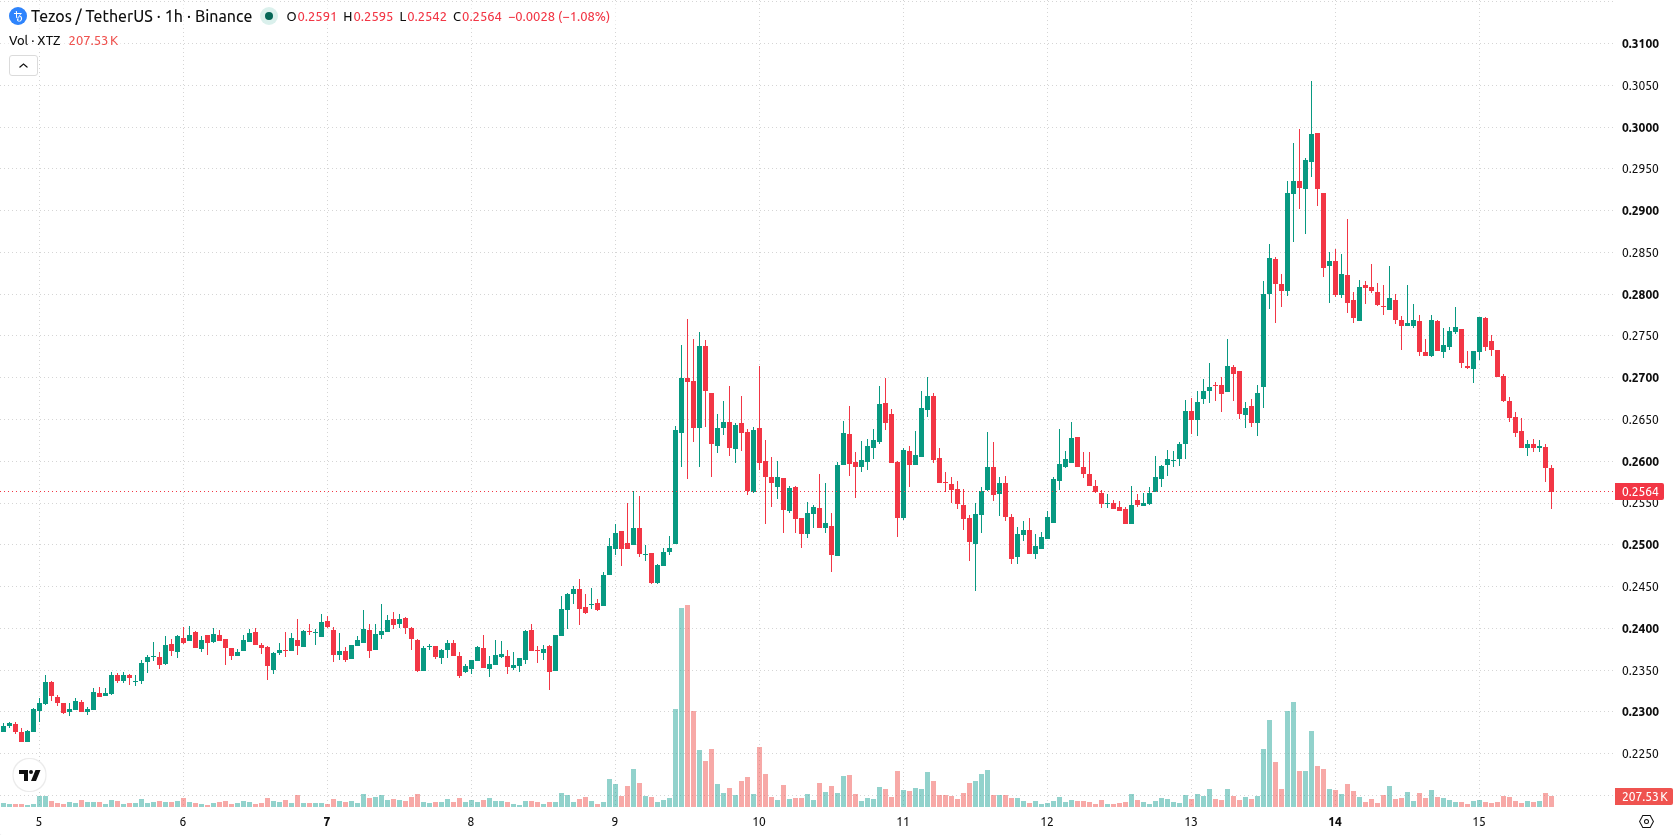
Tezos (XTZ) is trading at $0.2566, down 8.36% over the last 24 hours. The asset is currently positioned below its key moving averages.
 0.2529
0.28650000
Highlights
- XTZ/USD trades below key short-, medium- and long-term moving averages, confirming a persistent bearish trend across all timeframes.
- Oscillator signals indicate strong sell conditions with oversold momentum and sellers dominating intraday price action.
- Expected price range for the next 2 to 3 days is $0.24293762 to $0.2854, with a 73% probability of further downside.
Bearish momentum deepens as technical indicators confirm sell signals
XTZ/USD is trading below the MA-20 and MA-50 on the hourly chart, and also beneath the MA-200 on the daily chart. The Ichimoku Kijun on the daily timeframe is at $0.27065, marking immediate resistance. Momentum indicators are negative: MACD is on Sell, ADX is neutral, and Bull/Bear Power signals Sell. RSI stands at 30.63, reflecting strong Sell conditions, while both Stoch RSI and CCI are in oversold territory. The Awesome Oscillator also shows Sell, aligning with other bearish momentum signals.
Downside risk dominates as volatility drives short-term range
Over the next two to three days, XTZ/USD is expected to trade in a range between $0.24293762 and $0.2854 in line with recent volatility. There is a 73% probability of continued downside price action, while the chance of a rebound is estimated at 27%. The baseline scenario sees the pair contained within this band, with a potential bullish move requiring a break above $0.27065, and further decline likely if support at the lower end is breached.
Earlier, analysts noted that Tezos was exhibiting short-term downside momentum, with oversold technical signals suggesting a possible rebound if resistance levels were surpassed. The current analysis strengthens this bearish outlook, highlighting a heightened risk of further declines, with traders closely watching support near $0.24294 as a critical level for upcoming price action.











-
 Afghanistan
-
 Albania
-
 Algeria
-
 Angola
-
 Argentina
-
 Armenia
-
 Australia
-
 Austria
-
 Azerbaijan
-
 Bahamas
-
 Bahrain
-
 Bangladesh
-
 Belarus
-
 Belgium
-
 Bolivia
-
 Botswana
-
 Brazil
-
 Brunei
-
 Bulgaria
-
 Cambodia
-
 Cameroon
-
 Canada
-
 Chile
-
 China
-
 Colombia
-
 Congo
-
 Costa Rica
-
 Cote d'Ivoire
-
 Croatia
-
 Cuba
-
 Cyprus
-
 Czechia
-
 DR Congo
-
 Denmark
-
 Dominican Republic
-
 Ecuador
-
 Egypt
-
 El Salvador
-
 Estonia
-
 Eswatini
-
 Ethiopia
-
 Finland
-
 France
-
 Georgia
-
 Germany
-
 Ghana
-
 Greece
-
 Haiti
-
 Hong Kong
-
 Hungary
-
 India
-
 Indonesia
-
 Iran, Islamic republic
-
 Iraq
-
 Ireland
-
 Israel
-
 Italy
-
 Jamaica
-
 Japan
-
 Jordan
-
 Kazakhstan
-
 Kenya
-
 Korea
-
 Kuwait
-
 Kyrgyzstan
-
 Laos
-
 Latvia
-
 Lebanon
-
 Lesotho
-
 Libya
-
 Lithuania
-
 Luxembourg
-
 Madagascar
-
 Malaysia
-
 Malta
-
 Mauritius
-
 Mexico
-
 Moldova
-
 Mongolia
-
 Montenegro
-
 Morocco
-
 Mozambique
-
 Myanmar
-
 Namibia
-
 Nepal
-
 Netherlands
-
 New Zealand
-
 Nigeria
-
 North Macedonia
-
 Norway
-
 Oman
-
 Pakistan
-
 Palestine
-
 Panama
-
 Papua New Guinea
-
 Paraguay
-
 Peru
-
 Philippines
-
 Poland
-
 Portugal
-
 Puerto Rico
-
 Qatar
-
 Reunion
-
 Romania
-
 Rwanda
-
 Saudi Arabia
-
 Serbia
-
 Singapore
-
 Slovakia
-
 Slovenia
-
 Somalia
-
 South Africa
-
 Spain
-
 Sri Lanka
-
 Sweden
-
 Switzerland
-
 Syria
-
 Taiwan
-
 Tajikistan
-
 Tanzania
-
 Thailand
-
 Trinidad and Tobago
-
 Tunisia
-
 Turkey
-
 UAE
-
 Uganda
-
 Ukraine
-
 United Kingdom
-
United States
-
 Uruguay
-
 Uzbekistan
-
 Venezuela
-
 Vietnam
-
 Yemen
-
 Zambia
-
 Zimbabwe
- Forex
- Crypto












