

Tezos falls amid weak momentum and persistent seller pressure

Tezos (XTZ) is trading at $0.2182, marking a decline of 9.01% over the day. The asset sits below its key moving averages following today's sharp drop.
 0.2372
0.26850000
Highlights
- A new educational guide on Tezos outlines its operational structure, on-chain governance, staking features, and self-amendment capabilities to improve user understanding.
- This release aims to increase transparency and promote wider community participation in the Tezos network, though selling pressure on the token persists.
- XTZ remains in a strong bearish trend trading below key moving averages, with oversold signals suggesting a projected range of $0.1971 to $0.22676414 and a high likelihood of continued downside.
Community focus rises as educational release spotlights governance
A beginner's guide to Tezos was published, detailing the network's operational structure, its on-chain governance model, staking mechanisms, and distinctive self-amendment capabilities, according to Stylishnamees. This educational resource is designed to bolster user understanding of Tezos, which may enhance long-term community participation and clarity around the protocol's technology. The recent informational release highlights the project’s emphasis on transparency and accessible governance, though price action has remained under broader selling pressure.
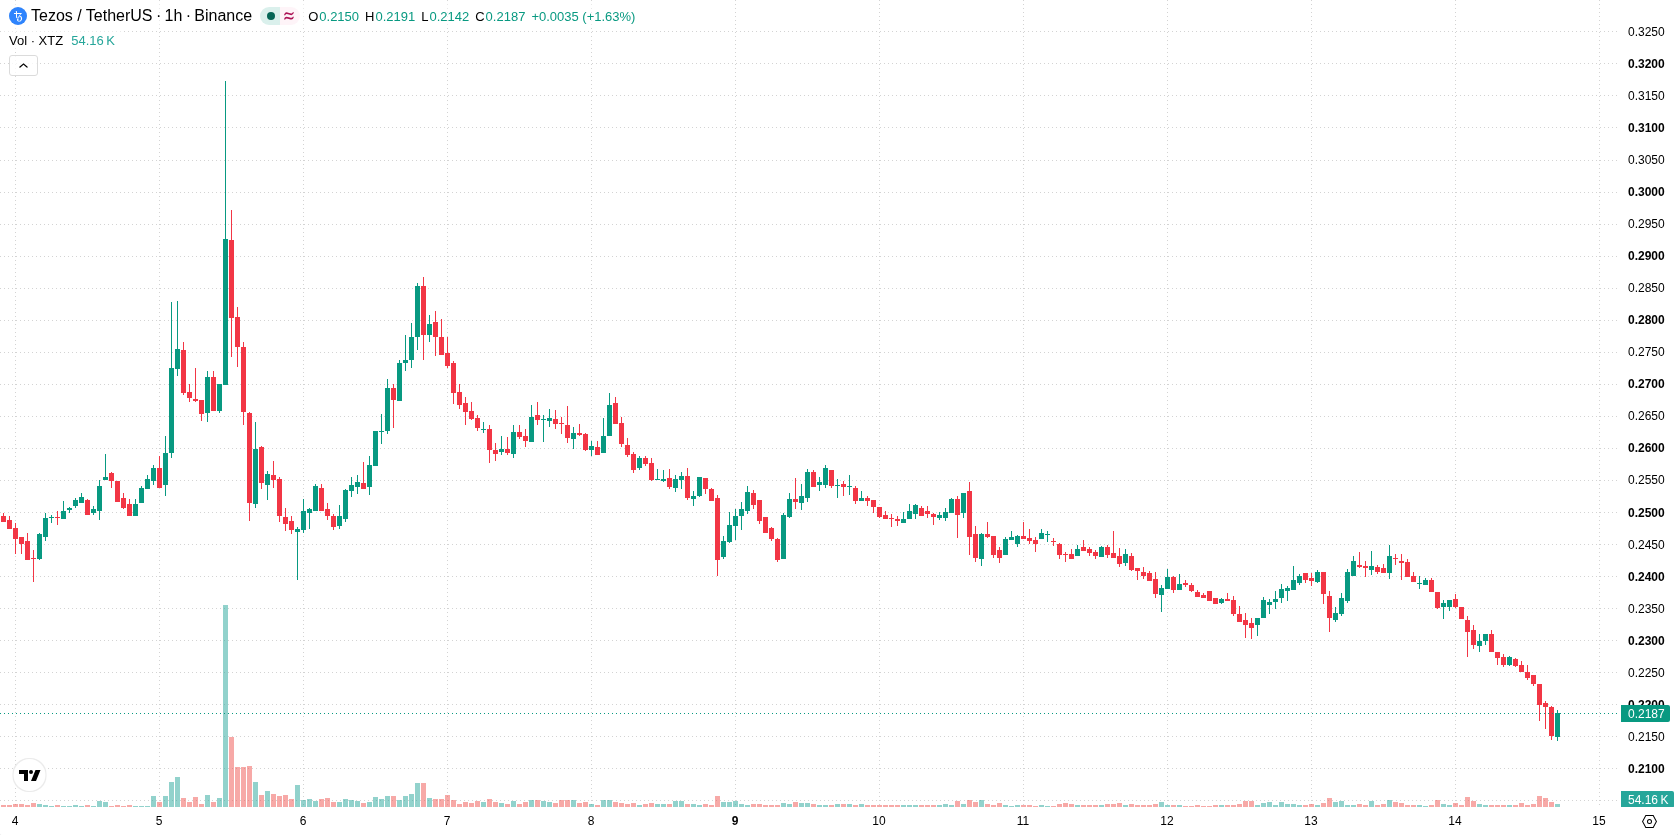
Deep oversold readings as bearish momentum and resistance levels persist
XTZ/USD trades below the MA-20 at $0.22801, MA-50 at $0.234636, and MA-200 at $0.2699115, indicating pronounced weakness on multiple timeframes. The Ichimoku Kijun at $0.2291 acts as immediate resistance, with momentum signals remaining notably bearish: both MACD and ADX register sell readings, while RSI at 14.63, Stoch RSI at 0, and CCI at –172.67 are all deep in oversold territory. Bull/Bear Power is negative at –0.00448014, and the Awesome Oscillator aligns with the broader bearish momentum. These indicator levels point to sustained selling pressure, although the depth of oversold oscillator readings raises the probability of potential, if temporary, exhaustion.
Sideways action likely as volatile range and downside risk dominate
Over the next 2–3 days, XTZ is projected to trade within the $0.1971 to $0.22676414 volatility band. The baseline scenario calls for sideways consolidation within this range. An upward break above $0.2291 could open the door to a short-term rebound, although this remains a low-probability scenario given ongoing bearish momentum. A bearish case would see a confirmed move below $0.1971, triggering further downside and highlighting the dominance of sellers in the near term.
Earlier, analysts noted that Tezos was exhibiting persistent technical weakness and remained under pressure amid limited bullish momentum. The latest decline to new lows reinforces the prevailing bearish bias, positioning the $0.1971 level as a critical downside risk to monitor in the coming sessions.











-
 Afghanistan
-
 Albania
-
 Algeria
-
 Angola
-
 Argentina
-
 Armenia
-
 Australia
-
 Austria
-
 Azerbaijan
-
 Bahamas
-
 Bahrain
-
 Bangladesh
-
 Belarus
-
 Belgium
-
 Bolivia
-
 Botswana
-
 Brazil
-
 Brunei
-
 Bulgaria
-
 Cambodia
-
 Cameroon
-
 Canada
-
 Chile
-
 China
-
 Colombia
-
 Congo
-
 Costa Rica
-
 Cote d'Ivoire
-
 Croatia
-
 Cuba
-
 Cyprus
-
 Czechia
-
 DR Congo
-
 Denmark
-
 Dominican Republic
-
 Ecuador
-
 Egypt
-
 El Salvador
-
 Estonia
-
 Eswatini
-
 Ethiopia
-
 Finland
-
 France
-
 Georgia
-
 Germany
-
 Ghana
-
 Greece
-
 Haiti
-
 Hong Kong
-
 Hungary
-
 India
-
 Indonesia
-
 Iran, Islamic republic
-
 Iraq
-
 Ireland
-
 Israel
-
 Italy
-
 Jamaica
-
 Japan
-
 Jordan
-
 Kazakhstan
-
 Kenya
-
 Korea
-
 Kuwait
-
 Kyrgyzstan
-
 Laos
-
 Latvia
-
 Lebanon
-
 Lesotho
-
 Libya
-
 Lithuania
-
 Luxembourg
-
 Madagascar
-
 Malaysia
-
 Malta
-
 Mauritius
-
 Mexico
-
 Moldova
-
 Mongolia
-
 Montenegro
-
 Morocco
-
 Mozambique
-
 Myanmar
-
 Namibia
-
 Nepal
-
 Netherlands
-
 New Zealand
-
 Nigeria
-
 North Macedonia
-
 Norway
-
 Oman
-
 Pakistan
-
 Palestine
-
 Panama
-
 Papua New Guinea
-
 Paraguay
-
 Peru
-
 Philippines
-
 Poland
-
 Portugal
-
 Puerto Rico
-
 Qatar
-
 Reunion
-
 Romania
-
 Rwanda
-
 Saudi Arabia
-
 Serbia
-
 Singapore
-
 Slovakia
-
 Slovenia
-
 Somalia
-
 South Africa
-
 Spain
-
 Sri Lanka
-
 Sweden
-
 Switzerland
-
 Syria
-
 Taiwan
-
 Tajikistan
-
 Tanzania
-
 Thailand
-
 Trinidad and Tobago
-
 Tunisia
-
 Turkey
-
 UAE
-
 Uganda
-
 Ukraine
-
 United Kingdom
-
United States
-
 Uruguay
-
 Uzbekistan
-
 Venezuela
-
 Vietnam
-
 Yemen
-
 Zambia
-
 Zimbabwe
- Forex
- Crypto












