

Tezos extends downward price move as sellers remain in control of short-term trend

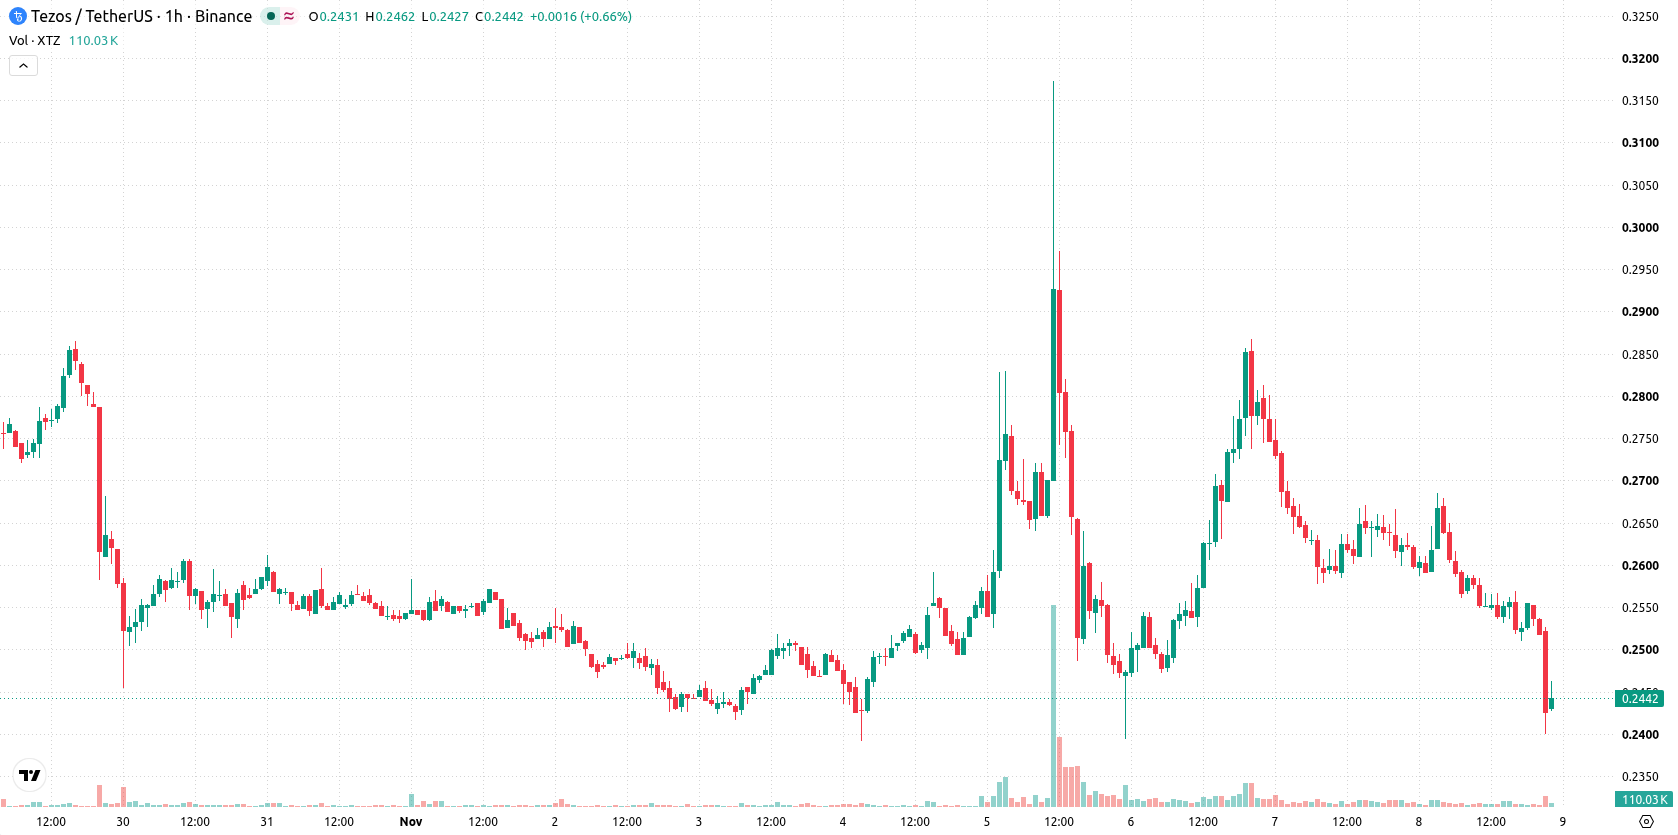
Tezos (XTZ) is trading at $0.2442, down 7.04% on the day. The asset remains below its key moving averages, reflecting continued short-term and long-term weakness.
 0.2685
0.31730000
Highlights
- XTZ/USD trades below key moving averages across all timeframes, indicating sustained selling pressure in short, medium, and long-term trends.
- Bearish signals from MACD and negative Bull/Bear Power are tempered by neutral readings from RSI, Stoch RSI, CCI, and ADX, showing downside momentum with weak trend conviction.
- Price is currently at $0.2442 after dropping 7.04% for the day, with a high probability of further declines into the $0.22671395 to $0.26168605 expected range.
Downside bias confirmed as resistances cap recovery
On the technical front, XTZ/USD is trading below its MA-20 and MA-50 on the H1 chart, and also sits under the MA-200 on the daily timeframe. The Ichimoku Kijun currently stands at $0.25974999 and acts as immediate resistance. MACD continues to issue a Sell signal, while ADX reads Neutral, reflecting downside momentum but limited trend conviction. RSI, Stoch RSI, and CCI are all in their neutral zones, signaling a lack of extreme momentum either way. Bull/Bear Power is negative, indicating sellers dominate the intraday bias, and the Awesome Oscillator maintains a downside reading.
Bearish continuation favored as break levels define risk
Given current technicals, Tezos is expected to remain within the $0.22671395 to $0.26168605 range during the next 2–3 trading days. The likelihood of further declines is high, while the probability of an upside move is low. Should price break above the Kijun resistance at $0.25974999, a bullish scenario could be triggered. Conversely, a breach below $0.22671395 would open the door to additional downside within the current volatility band.
Previously it was reported that Tezos was facing sideways movement within a defined volatility band amid mixed technical signals. The current analysis reinforces this cautious outlook, highlighting that the asset remains under pressure and suggesting traders should watch for a break of the $0.2267 support to gauge further downside risk.











-
 Afghanistan
-
 Albania
-
 Algeria
-
 Angola
-
 Argentina
-
 Armenia
-
 Australia
-
 Austria
-
 Azerbaijan
-
 Bahamas
-
 Bahrain
-
 Bangladesh
-
 Belarus
-
 Belgium
-
 Bolivia
-
 Botswana
-
 Brazil
-
 Brunei
-
 Bulgaria
-
 Cambodia
-
 Cameroon
-
 Canada
-
 Chile
-
 China
-
 Colombia
-
 Congo
-
 Costa Rica
-
 Cote d'Ivoire
-
 Croatia
-
 Cuba
-
 Cyprus
-
 Czechia
-
 DR Congo
-
 Denmark
-
 Dominican Republic
-
 Ecuador
-
 Egypt
-
 El Salvador
-
 Estonia
-
 Eswatini
-
 Ethiopia
-
 Finland
-
 France
-
 Georgia
-
 Germany
-
 Ghana
-
 Greece
-
 Haiti
-
 Hong Kong
-
 Hungary
-
 India
-
 Indonesia
-
 Iran, Islamic republic
-
 Iraq
-
 Ireland
-
 Israel
-
 Italy
-
 Jamaica
-
 Japan
-
 Jordan
-
 Kazakhstan
-
 Kenya
-
 Korea
-
 Kuwait
-
 Kyrgyzstan
-
 Laos
-
 Latvia
-
 Lebanon
-
 Lesotho
-
 Libya
-
 Lithuania
-
 Luxembourg
-
 Madagascar
-
 Malaysia
-
 Malta
-
 Mauritius
-
 Mexico
-
 Moldova
-
 Mongolia
-
 Montenegro
-
 Morocco
-
 Mozambique
-
 Myanmar
-
 Namibia
-
 Nepal
-
 Netherlands
-
 New Zealand
-
 Nigeria
-
 North Macedonia
-
 Norway
-
 Oman
-
 Pakistan
-
 Palestine
-
 Panama
-
 Papua New Guinea
-
 Paraguay
-
 Peru
-
 Philippines
-
 Poland
-
 Portugal
-
 Puerto Rico
-
 Qatar
-
 Reunion
-
 Romania
-
 Rwanda
-
 Saudi Arabia
-
 Serbia
-
 Singapore
-
 Slovakia
-
 Slovenia
-
 Somalia
-
 South Africa
-
 Spain
-
 Sri Lanka
-
 Sweden
-
 Switzerland
-
 Syria
-
 Taiwan
-
 Tajikistan
-
 Tanzania
-
 Thailand
-
 Trinidad and Tobago
-
 Tunisia
-
 Turkey
-
 UAE
-
 Uganda
-
 Ukraine
-
 United Kingdom
-
United States
-
 Uruguay
-
 Uzbekistan
-
 Venezuela
-
 Vietnam
-
 Yemen
-
 Zambia
-
 Zimbabwe
- Forex
- Crypto












