

Tezos technical analysis: Downward move continues as momentum signals remain mixed

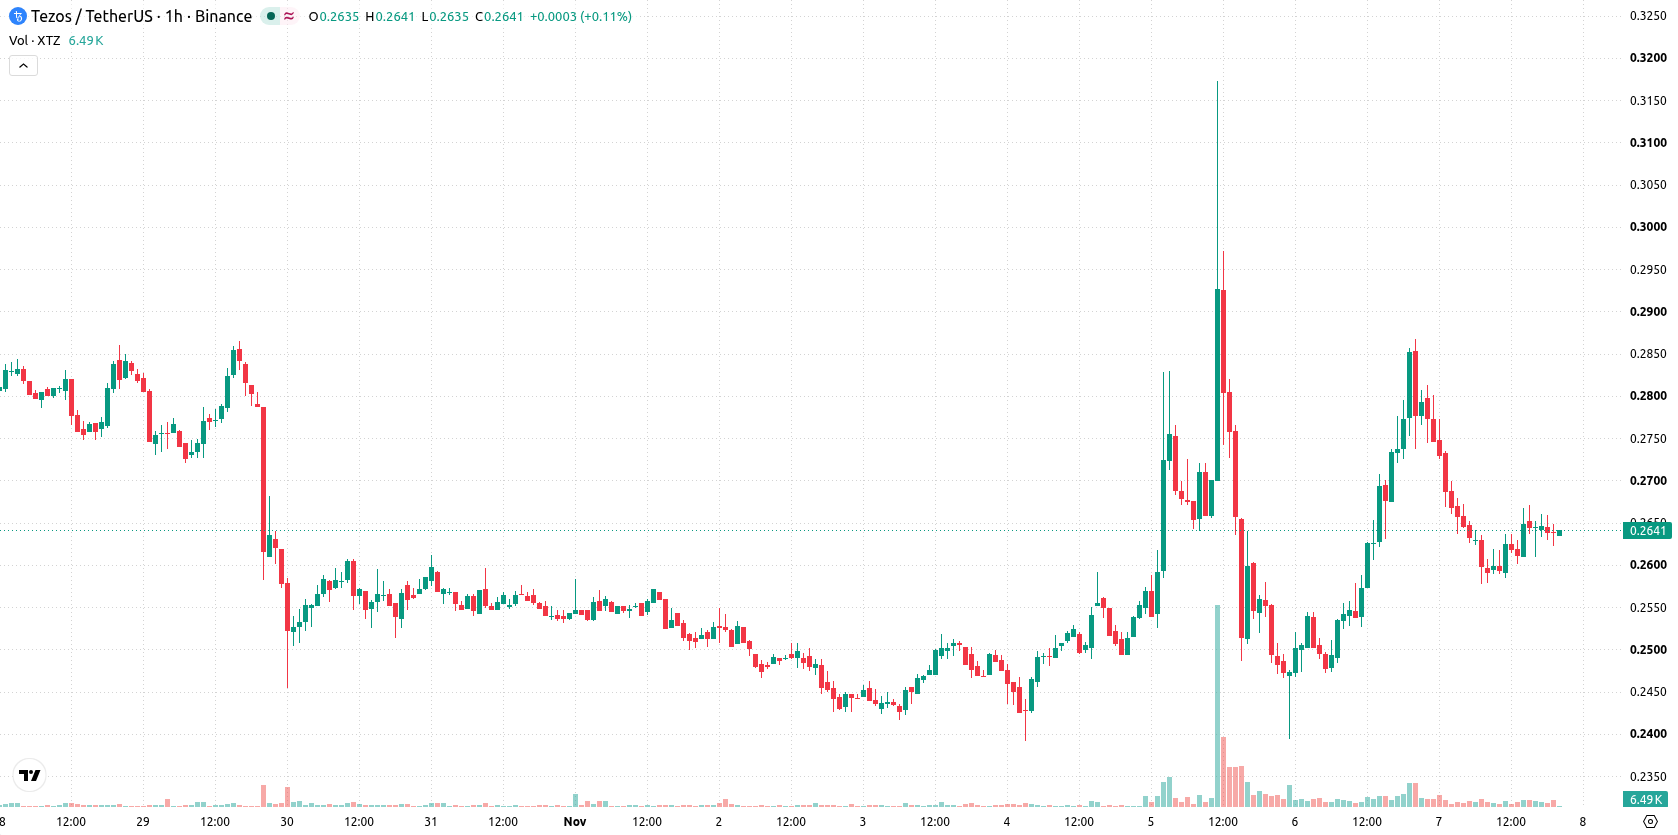
Tezos (XTZ) is trading at $0.2638, down 7.44% on the day. The asset is currently positioned below its short-term moving averages, but still maintains a level above medium-term trends.
 0.2173
0.25470000
Highlights
- XTZ/USD trades below its short-term and long-term moving averages, showing short-term bearishness and overall seller control.
- Intraday price slipped 7.44% to $0.2638 with high volatility, closing near the session low after a sharp drop.
- The price is expected to consolidate between $0.24631395 and $0.28128605 over the next 2 to 3 days, with mixed momentum signals and a 53% probability of an upward move.
Short-term weakness persists amid neutral momentum signals
On the technical front, XTZ/USD is trading below its MA-20 and above its MA-50 on the hourly chart, yet remains under its MA-200, indicating short-term weakness against a backdrop of lingering medium-term support. The Ichimoku Kijun at $0.2722 represents immediate resistance, while downside focus is guided by the recent fall to $0.2638. MACD prints a strong sell, whereas ADX is neutral. RSI and CCI maintain neutral stances, the Stochastic RSI is currently in the overbought territory, and Bull/Bear Power reflects mild buyer pressure. The Awesome Oscillator remains neutral, suggesting an absence of clear directional momentum among oscillators.
Sideways movement likely as breakout risks define outlook
Looking ahead to the next 2–3 trading days, XTZ is forecast to fluctuate within a typical volatility band between $0.24631395 and $0.28128605. The base expectation is for sideways movement within this corridor. A bullish scenario would be triggered by a breakout above the $0.2722 resistance area, targeting the upper end of the range, while a bearish scenario could develop if price breaks below support, potentially driving a retest of the projected lower boundary.
Previously, it was reported that Tezos gained support from speculative interest and ecosystem developments, although momentum signals remained mixed. Currently, the lack of clear directional cues and the convergence of neutral technical indicators highlight the importance of monitoring for a decisive break outside the recent $0.2463–$0.2813 volatility band for the next actionable move.











-
 Afghanistan
-
 Albania
-
 Algeria
-
 Angola
-
 Argentina
-
 Armenia
-
 Australia
-
 Austria
-
 Azerbaijan
-
 Bahamas
-
 Bahrain
-
 Bangladesh
-
 Belarus
-
 Belgium
-
 Bolivia
-
 Botswana
-
 Brazil
-
 Brunei
-
 Bulgaria
-
 Cambodia
-
 Cameroon
-
 Canada
-
 Chile
-
 China
-
 Colombia
-
 Congo
-
 Costa Rica
-
 Cote d'Ivoire
-
 Croatia
-
 Cuba
-
 Cyprus
-
 Czechia
-
 DR Congo
-
 Denmark
-
 Dominican Republic
-
 Ecuador
-
 Egypt
-
 El Salvador
-
 Estonia
-
 Eswatini
-
 Ethiopia
-
 Finland
-
 France
-
 Georgia
-
 Germany
-
 Ghana
-
 Greece
-
 Haiti
-
 Hong Kong
-
 Hungary
-
 India
-
 Indonesia
-
 Iran, Islamic republic
-
 Iraq
-
 Ireland
-
 Israel
-
 Italy
-
 Jamaica
-
 Japan
-
 Jordan
-
 Kazakhstan
-
 Kenya
-
 Korea
-
 Kuwait
-
 Kyrgyzstan
-
 Laos
-
 Latvia
-
 Lebanon
-
 Lesotho
-
 Libya
-
 Lithuania
-
 Luxembourg
-
 Madagascar
-
 Malaysia
-
 Malta
-
 Mauritius
-
 Mexico
-
 Moldova
-
 Mongolia
-
 Montenegro
-
 Morocco
-
 Mozambique
-
 Myanmar
-
 Namibia
-
 Nepal
-
 Netherlands
-
 New Zealand
-
 Nigeria
-
 North Macedonia
-
 Norway
-
 Oman
-
 Pakistan
-
 Palestine
-
 Panama
-
 Papua New Guinea
-
 Paraguay
-
 Peru
-
 Philippines
-
 Poland
-
 Portugal
-
 Puerto Rico
-
 Qatar
-
 Reunion
-
 Romania
-
 Rwanda
-
 Saudi Arabia
-
 Serbia
-
 Singapore
-
 Slovakia
-
 Slovenia
-
 Somalia
-
 South Africa
-
 Spain
-
 Sri Lanka
-
 Sweden
-
 Switzerland
-
 Syria
-
 Taiwan
-
 Tajikistan
-
 Tanzania
-
 Thailand
-
 Trinidad and Tobago
-
 Tunisia
-
 Turkey
-
 UAE
-
 Uganda
-
 Ukraine
-
 United Kingdom
-
United States
-
 Uruguay
-
 Uzbekistan
-
 Venezuela
-
 Vietnam
-
 Yemen
-
 Zambia
-
 Zimbabwe
- Forex
- Crypto












