

Polygon price prediction: Rally follows Stable.com partnership news

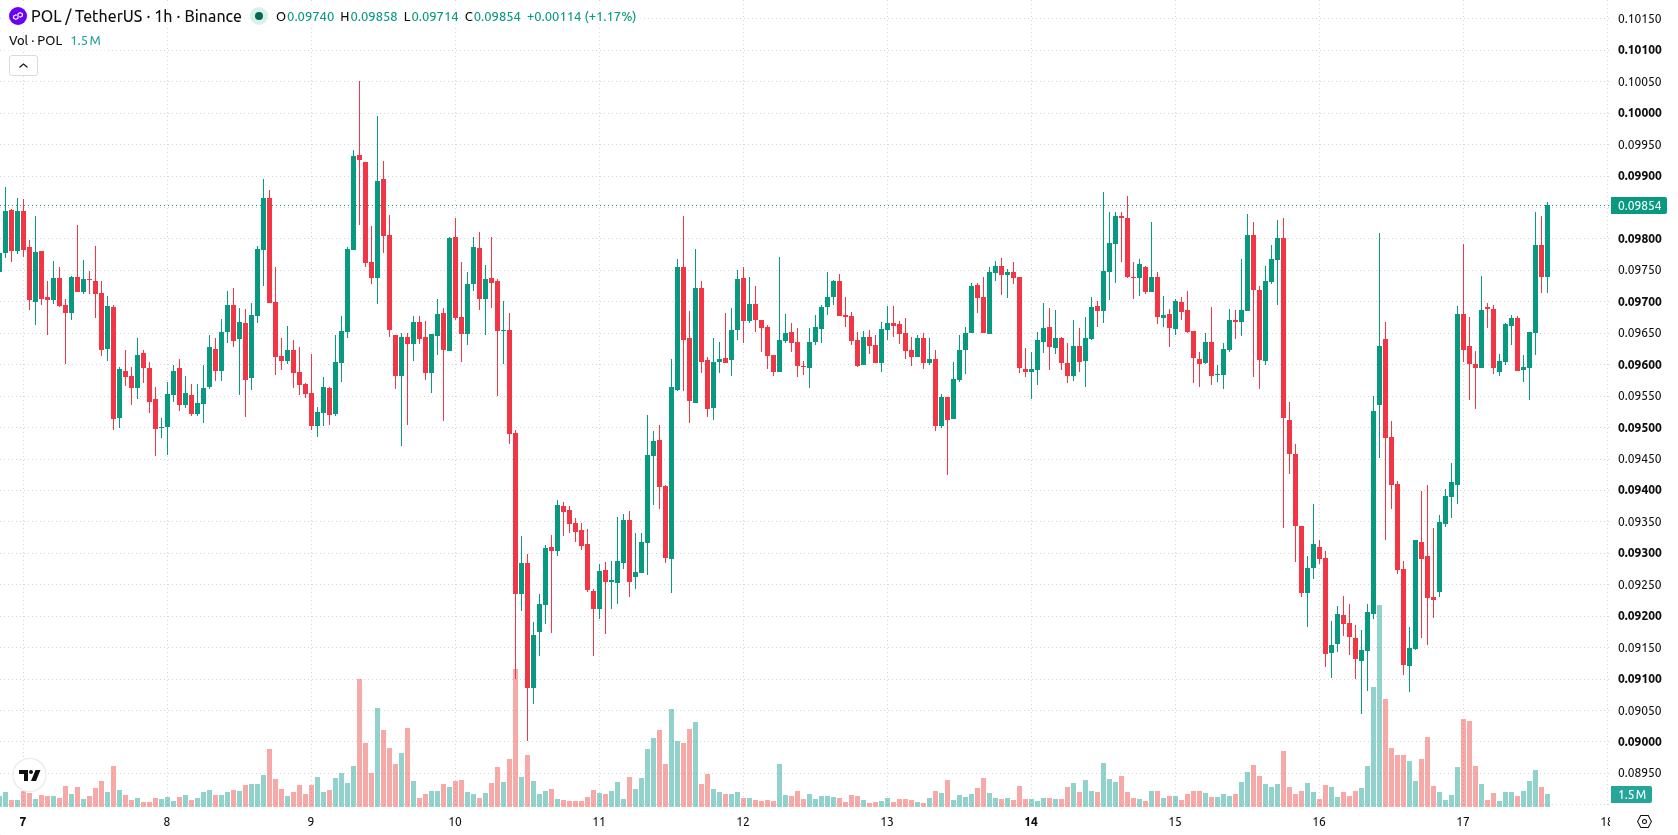
Polygon (POL) is trading at $0.0984, up 7.05% on the day, and sits above its key moving averages. The asset is showing strong upside momentum with price near intraday highs.
 0.0883
0.1001
Highlights
- Polygon partnered with Stable.com to enable direct USDT and PYUSD transfers from crypto wallets to bank accounts in over 180 countries, widening global money transfer capabilities.
- Arc integrated with Polygon’s Open Money Stack to offer one-click USDC crosschain payments between networks such as Ethereum and Solana, broadening DeFi interoperability.
- POL/USD gained 7.05% to $0.0984 with technical indicators confirming a strong uptrend and projected consolidation in the $0.0965 to $0.1003 range over the next 2 to 3 days.
Crosschain partnerships boost demand as Polygon expands payments reach
Polygon has entered a partnership with Stable.com to enable direct USDT and PYUSD transfers from custodial crypto wallets to bank accounts in over 180 countries using the Polygon Open Money Stack, according to Hokanews. This collaboration expands Polygon's practical utility for international money movement and increases on-chain settlement demand, directly enhancing its appeal to both retail and institutional users. Separately, Arc integrated with Polygon’s Open Money Stack to offer one-click USDC crosschain payments between networks such as Ethereum and Solana, facilitating easier interoperability and strengthening Polygon’s position as a core DeFi infrastructure provider.
Overbought signals emerge as upward trend dominates technical setup
On the hourly chart, POL/USD is trading above the MA-20 at $0.0957 and MA-50 at $0.0946, as well as above the long-term MA-200 at $0.0879. The Ichimoku Kijun sits at $0.0946, acting as immediate support. Momentum indicators including MACD and ADX are pointed firmly upward, favoring trend continuation. RSI, Stoch RSI, and CCI all signal overbought conditions, indicating the move may be stretched short term. Bull/Bear Power confirms buyers dominate intraday momentum, while the Awesome Oscillator reinforces the prevailing upward bias.
Upside bias prevails as price consolidates near resistance zone
In the next two to three trading days, expected price action for POL/USD is likely to remain within the $0.0965 to $0.1003 corridor, reflecting typical volatility for the current setup. The probability of further upside remains very high, with a minor likelihood of a downward move unless price decisively breaks below nearby support. Baseline expectations call for consolidation near session highs, while a break above resistance could trigger an extension higher; downside risk would only emerge if key support levels fail.
Earlier, analysts noted that Polygon faced downside pressure and a cautious technical outlook amid oversold conditions and uncertain momentum. The current article signals a shift in market dynamics, as robust upside momentum and expanding utility from new partnerships now put focus on whether sustained buying can push POL beyond its recent high-volatility corridor.











-
 Afghanistan
-
 Albania
-
 Algeria
-
 Angola
-
 Argentina
-
 Armenia
-
 Australia
-
 Austria
-
 Azerbaijan
-
 Bahamas
-
 Bahrain
-
 Bangladesh
-
 Belarus
-
 Belgium
-
 Bolivia
-
 Botswana
-
 Brazil
-
 Brunei
-
 Bulgaria
-
 Cambodia
-
 Cameroon
-
 Canada
-
 Chile
-
 China
-
 Colombia
-
 Congo
-
 Costa Rica
-
 Cote d'Ivoire
-
 Croatia
-
 Cuba
-
 Cyprus
-
 Czechia
-
 DR Congo
-
 Denmark
-
 Dominican Republic
-
 Ecuador
-
 Egypt
-
 El Salvador
-
 Estonia
-
 Eswatini
-
 Ethiopia
-
 Finland
-
 France
-
 Georgia
-
 Germany
-
 Ghana
-
 Greece
-
 Haiti
-
 Hong Kong
-
 Hungary
-
 India
-
 Indonesia
-
 Iran, Islamic republic
-
 Iraq
-
 Ireland
-
 Israel
-
 Italy
-
 Jamaica
-
 Japan
-
 Jordan
-
 Kazakhstan
-
 Kenya
-
 Korea
-
 Kuwait
-
 Kyrgyzstan
-
 Laos
-
 Latvia
-
 Lebanon
-
 Lesotho
-
 Libya
-
 Lithuania
-
 Luxembourg
-
 Madagascar
-
 Malaysia
-
 Malta
-
 Mauritius
-
 Mexico
-
 Moldova
-
 Mongolia
-
 Montenegro
-
 Morocco
-
 Mozambique
-
 Myanmar
-
 Namibia
-
 Nepal
-
 Netherlands
-
 New Zealand
-
 Nigeria
-
 North Macedonia
-
 Norway
-
 Oman
-
 Pakistan
-
 Palestine
-
 Panama
-
 Papua New Guinea
-
 Paraguay
-
 Peru
-
 Philippines
-
 Poland
-
 Portugal
-
 Puerto Rico
-
 Qatar
-
 Reunion
-
 Romania
-
 Rwanda
-
 Saudi Arabia
-
 Serbia
-
 Singapore
-
 Slovakia
-
 Slovenia
-
 Somalia
-
 South Africa
-
 Spain
-
 Sri Lanka
-
 Sweden
-
 Switzerland
-
 Syria
-
 Taiwan
-
 Tajikistan
-
 Tanzania
-
 Thailand
-
 Trinidad and Tobago
-
 Tunisia
-
 Turkey
-
 UAE
-
 Uganda
-
 Ukraine
-
 United Kingdom
-
United States
-
 Uruguay
-
 Uzbekistan
-
 Venezuela
-
 Vietnam
-
 Yemen
-
 Zambia
-
 Zimbabwe
- Forex
- Crypto












