

What's behind Plasma's latest 10.4% price surge?

Plasma (XPL) surged 10.38% in an intraday rally driven by firm technical momentum and oversold signals prompting buyers back into the market. The recovery looks limited with the price still below the 200-day moving average and long-term indicators capping further upside.
 0.0472
0.0505
Highlights
- XPL/USD remains under its 200-day moving average, establishing a bearish long-term technical structure despite short-term support.
- The pair is trading between a resistance level at $0.0881 and support at $0.0864, with intraday volatility of 10.26%.
- Technical indicators are mixed, but a 77% probability favors further downside with expected consolidation in the $0.08 to $0.0941 range over the next five sessions.
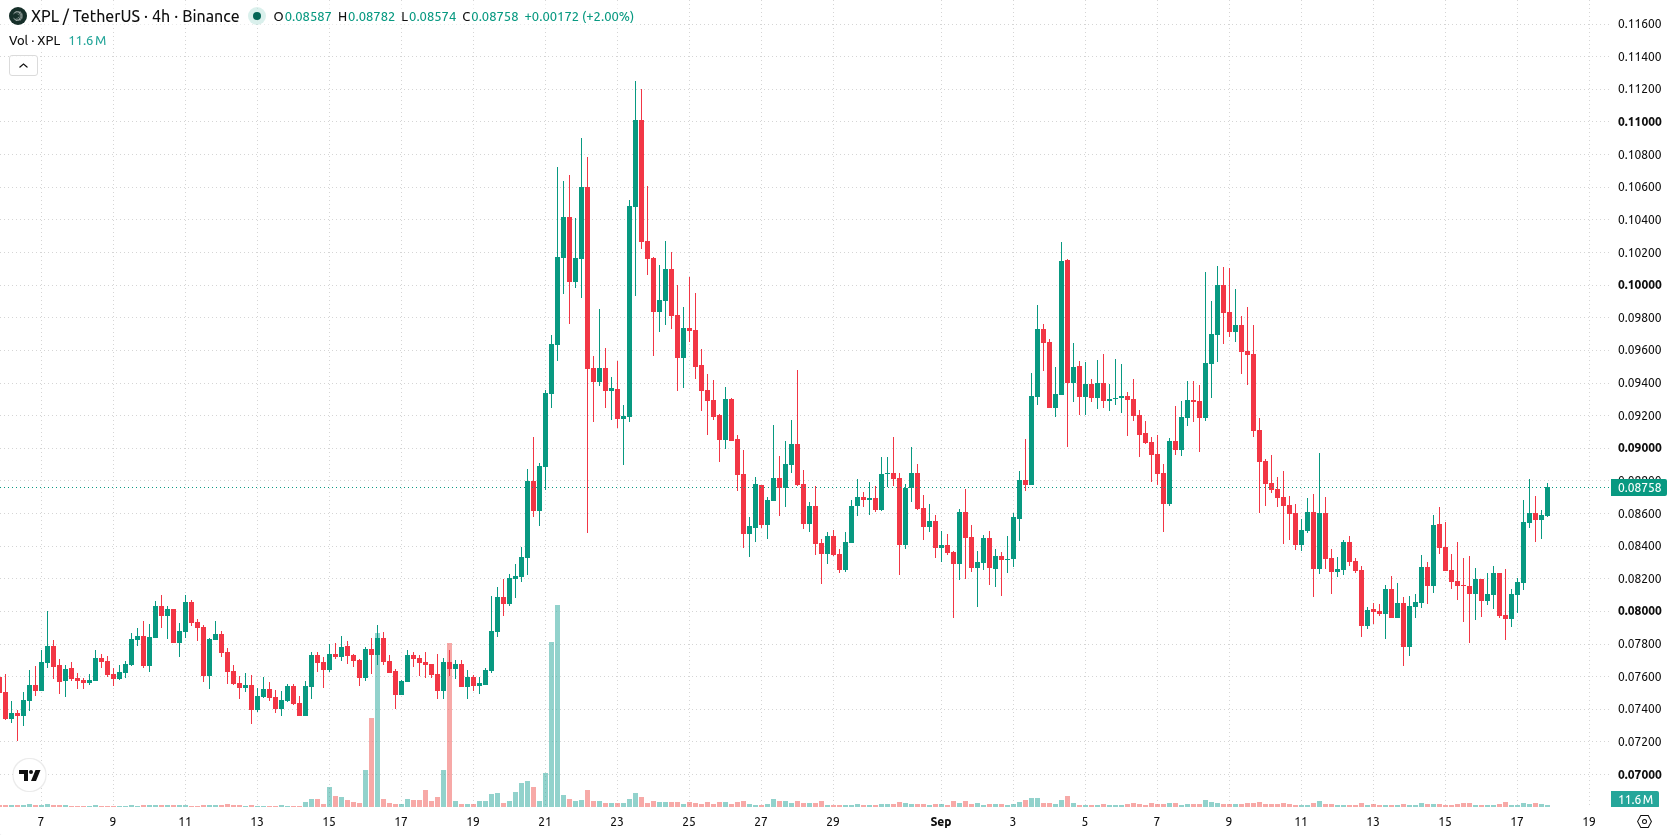
Technical support holds as long-term trend and momentum diverge
XPL/USD has moved above its 20-day and 50-day moving averages at $0.0864 and $0.0832, but remains below the 200-day moving average at $0.0937, signaling short- and medium-term support with long-term bearish alignment. The pair is currently holding between a near-term ceiling at $0.0881 and a floor at $0.0864, with the Ichimoku Kijun at $0.0946 confirming downside pressure in the longer-term trend context. Momentum readings are conflicting: the Moving Average Convergence Divergence (MACD) remains negative and forecasts further weakness, but the Average Directional Index (ADX) indicates some buying pressure. Both the Relative Strength Index (RSI) and Commodity Channel Index (CCI) are in oversold territory and point to a potential for rebound, yet Bull/Bear Power (BBP) shows sellers still dominating intraday. The Stochastic RSI also supports an oversold reading. The pair advanced to $0.0876 today, rising 10.38% with an upside gap of about 2.02%, trading near its daily high and posting intraday volatility of 10.26%. The intraday tone is firm, showing strength toward highs, yet momentum signals and oscillators diverge and suggest caution despite the price advance.
Earlier, analysts noted that Plasma was exhibiting short-term bullish consolidation but remained constrained by longer-term resistance levels. The latest price action adds a layer of caution as oscillators now point to conflicting momentum signals, making it essential for traders to watch for a confirmed breakout or breakdown beyond the projected $0.08 to $0.0941 trading range.






Latest Plasma News




-
 Afghanistan
-
 Albania
-
 Algeria
-
 Angola
-
 Argentina
-
 Armenia
-
 Australia
-
 Austria
-
 Azerbaijan
-
 Bahamas
-
 Bahrain
-
 Bangladesh
-
 Belarus
-
 Belgium
-
 Bolivia
-
 Botswana
-
 Brazil
-
 Brunei
-
 Bulgaria
-
 Cambodia
-
 Cameroon
-
 Canada
-
 Chile
-
 China
-
 Colombia
-
 Congo
-
 Costa Rica
-
 Cote d'Ivoire
-
 Croatia
-
 Cuba
-
 Cyprus
-
 Czechia
-
 DR Congo
-
 Denmark
-
 Dominican Republic
-
 Ecuador
-
 Egypt
-
 El Salvador
-
 Estonia
-
 Eswatini
-
 Ethiopia
-
 Finland
-
 France
-
 Georgia
-
 Germany
-
 Ghana
-
 Greece
-
 Haiti
-
 Hong Kong
-
 Hungary
-
 India
-
 Indonesia
-
 Iran, Islamic republic
-
 Iraq
-
 Ireland
-
 Israel
-
 Italy
-
 Jamaica
-
 Japan
-
 Jordan
-
 Kazakhstan
-
 Kenya
-
 Korea
-
 Kuwait
-
 Kyrgyzstan
-
 Laos
-
 Latvia
-
 Lebanon
-
 Lesotho
-
 Libya
-
 Lithuania
-
 Luxembourg
-
 Madagascar
-
 Malaysia
-
 Malta
-
 Mauritius
-
 Mexico
-
 Moldova
-
 Mongolia
-
 Montenegro
-
 Morocco
-
 Mozambique
-
 Myanmar
-
 Namibia
-
 Nepal
-
 Netherlands
-
 New Zealand
-
 Nigeria
-
 North Macedonia
-
 Norway
-
 Oman
-
 Pakistan
-
 Palestine
-
 Panama
-
 Papua New Guinea
-
 Paraguay
-
 Peru
-
 Philippines
-
 Poland
-
 Portugal
-
 Puerto Rico
-
 Qatar
-
 Reunion
-
 Romania
-
 Rwanda
-
 Saudi Arabia
-
 Serbia
-
 Singapore
-
 Slovakia
-
 Slovenia
-
 Somalia
-
 South Africa
-
 Spain
-
 Sri Lanka
-
 Sweden
-
 Switzerland
-
 Syria
-
 Taiwan
-
 Tajikistan
-
 Tanzania
-
 Thailand
-
 Trinidad and Tobago
-
 Tunisia
-
 Turkey
-
 UAE
-
 Uganda
-
 Ukraine
-
 United Kingdom
-
United States
-
 Uruguay
-
 Uzbekistan
-
 Venezuela
-
 Vietnam
-
 Yemen
-
 Zambia
-
 Zimbabwe
- Forex
- Crypto












