


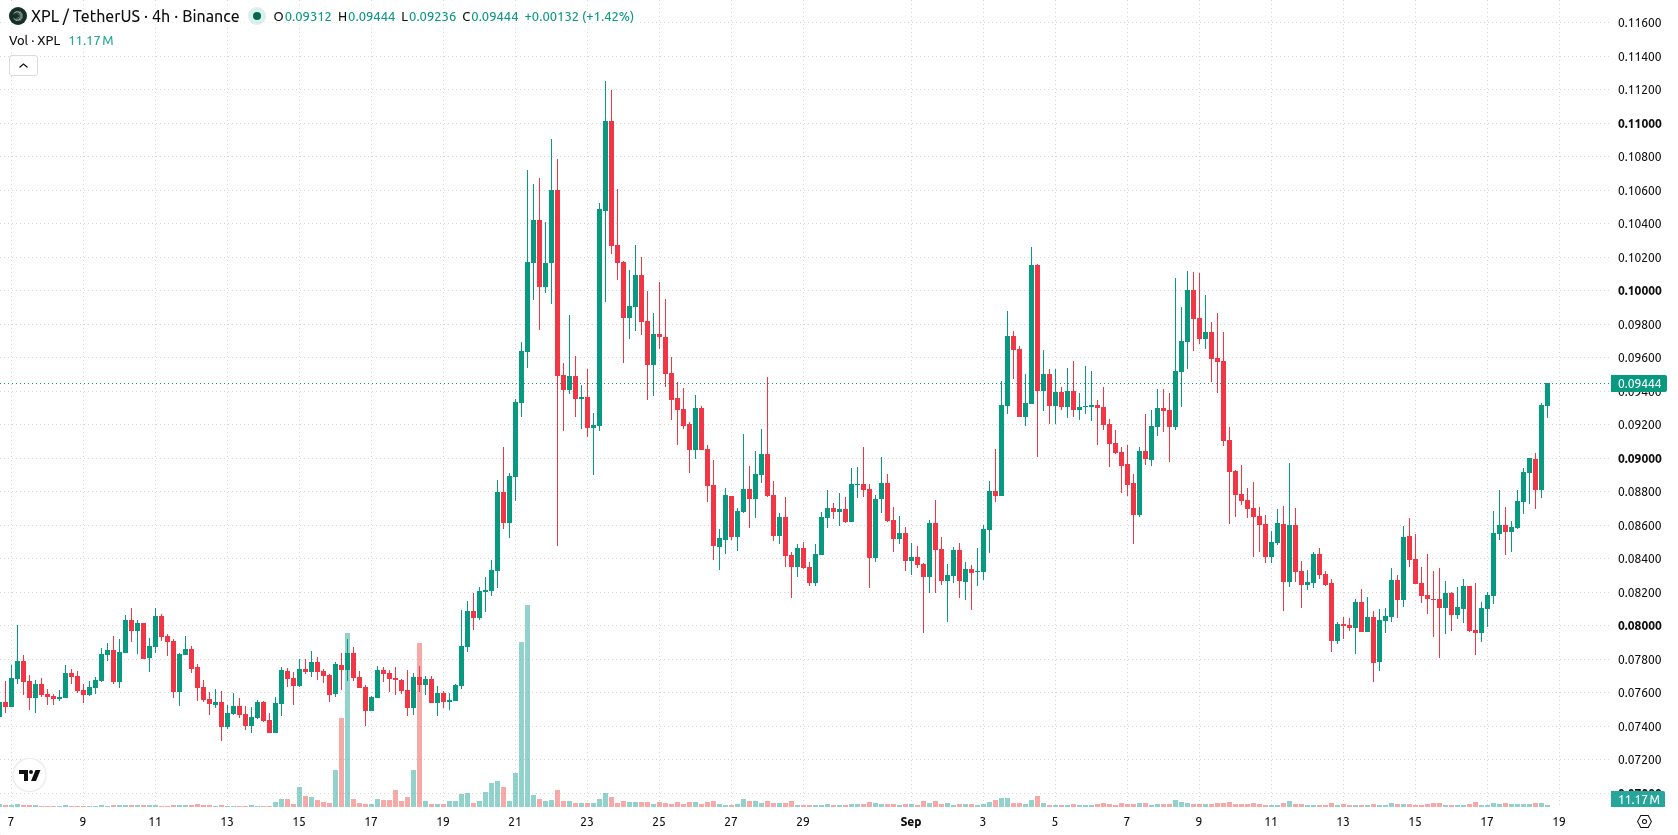
Plasma (XPL) surged 10.4% today, driven by strong technical momentum and clear buying pressure as it remains above its 20-day, 50-day, and 200-day moving averages. The positive move is partly contradicted by lingering mixed signals from key oscillators and a longer-term bearish alignment.
 0.0779
0.0885
Highlights
- XPL/USD is trading above its 20-day, 50-day, and 200-day moving averages, indicating sustained bullish pressure across all timeframes.
- Mixed momentum signals are present, with the MACD forecasting a sell, but ADX and Stochastic RSI suggesting growing buying interest.
- A breakout above $0.0946 may prompt a move toward $0.1, while a drop below $0.0936 could expose $0.0863, with a 68% chance of upside over the next five days.
Bullish bias as moving averages hold, but oscillators flash caution
XPL/USD is trading above its 20-day, 50-day, and 200-day moving averages at $0.0865, $0.0834, and $0.0936, respectively, indicating bullish pressure across all timeframes. Immediate direction depends on a break of the near-term ceiling at $0.0946 (Ichimoku Kijun) or support at the floor of $0.0936 (MA-200), with longer-term alignment still bearish. Momentum from the Moving Average Convergence Divergence (MACD) remains negative with a sell forecast, contrasted by the Average Directional Index (ADX) and Stochastic RSI, which suggest building buying interest. The Relative Strength Index (RSI) hovers near neutral levels but signals a mild sell setup, while the Commodity Channel Index (CCI) offers no strong directional cue. Bull/Bear Power (BBP) is positive at 0.0034, indicating buyers currently dominate intraday moves. Price action reflects firm buying strength toward session highs, though momentum signals are mixed across oscillators.
Earlier, analysts noted that Plasma was showing firm bullish momentum even as longer-term resistance levels limited further upside. The latest data adds a layer of complexity, as despite continued buying pressure, traders should monitor for resolution of the mixed oscillator signals, with special attention to price action around the $0.0946 resistance, as it may dictate the next significant move.









-
 Afghanistan
-
 Albania
-
 Algeria
-
 Angola
-
 Argentina
-
 Armenia
-
 Australia
-
 Austria
-
 Azerbaijan
-
 Bahamas
-
 Bahrain
-
 Bangladesh
-
 Belarus
-
 Belgium
-
 Bolivia
-
 Botswana
-
 Brazil
-
 Brunei
-
 Bulgaria
-
 Cambodia
-
 Cameroon
-
 Canada
-
 Chile
-
 China
-
 Colombia
-
 Congo
-
 Costa Rica
-
 Cote d'Ivoire
-
 Croatia
-
 Cuba
-
 Cyprus
-
 Czechia
-
 DR Congo
-
 Denmark
-
 Dominican Republic
-
 Ecuador
-
 Egypt
-
 El Salvador
-
 Estonia
-
 Eswatini
-
 Ethiopia
-
 Finland
-
 France
-
 Georgia
-
 Germany
-
 Ghana
-
 Greece
-
 Haiti
-
 Hong Kong
-
 Hungary
-
 India
-
 Indonesia
-
 Iran, Islamic republic
-
 Iraq
-
 Ireland
-
 Israel
-
 Italy
-
 Jamaica
-
 Japan
-
 Jordan
-
 Kazakhstan
-
 Kenya
-
 Korea
-
 Kuwait
-
 Kyrgyzstan
-
 Laos
-
 Latvia
-
 Lebanon
-
 Lesotho
-
 Libya
-
 Lithuania
-
 Luxembourg
-
 Madagascar
-
 Malaysia
-
 Malta
-
 Mauritius
-
 Mexico
-
 Moldova
-
 Mongolia
-
 Montenegro
-
 Morocco
-
 Mozambique
-
 Myanmar
-
 Namibia
-
 Nepal
-
 Netherlands
-
 New Zealand
-
 Nigeria
-
 North Macedonia
-
 Norway
-
 Oman
-
 Pakistan
-
 Palestine
-
 Panama
-
 Papua New Guinea
-
 Paraguay
-
 Peru
-
 Philippines
-
 Poland
-
 Portugal
-
 Puerto Rico
-
 Qatar
-
 Reunion
-
 Romania
-
 Rwanda
-
 Saudi Arabia
-
 Serbia
-
 Singapore
-
 Slovakia
-
 Slovenia
-
 Somalia
-
 South Africa
-
 Spain
-
 Sri Lanka
-
 Sweden
-
 Switzerland
-
 Syria
-
 Taiwan
-
 Tajikistan
-
 Tanzania
-
 Thailand
-
 Trinidad and Tobago
-
 Tunisia
-
 Turkey
-
 UAE
-
 Uganda
-
 Ukraine
-
 United Kingdom
-
United States
-
 Uruguay
-
 Uzbekistan
-
 Venezuela
-
 Vietnam
-
 Yemen
-
 Zambia
-
 Zimbabwe
- Forex
- Crypto












