

Plasma breakout attempt at $0.0936 resistance: Upside targets to watch

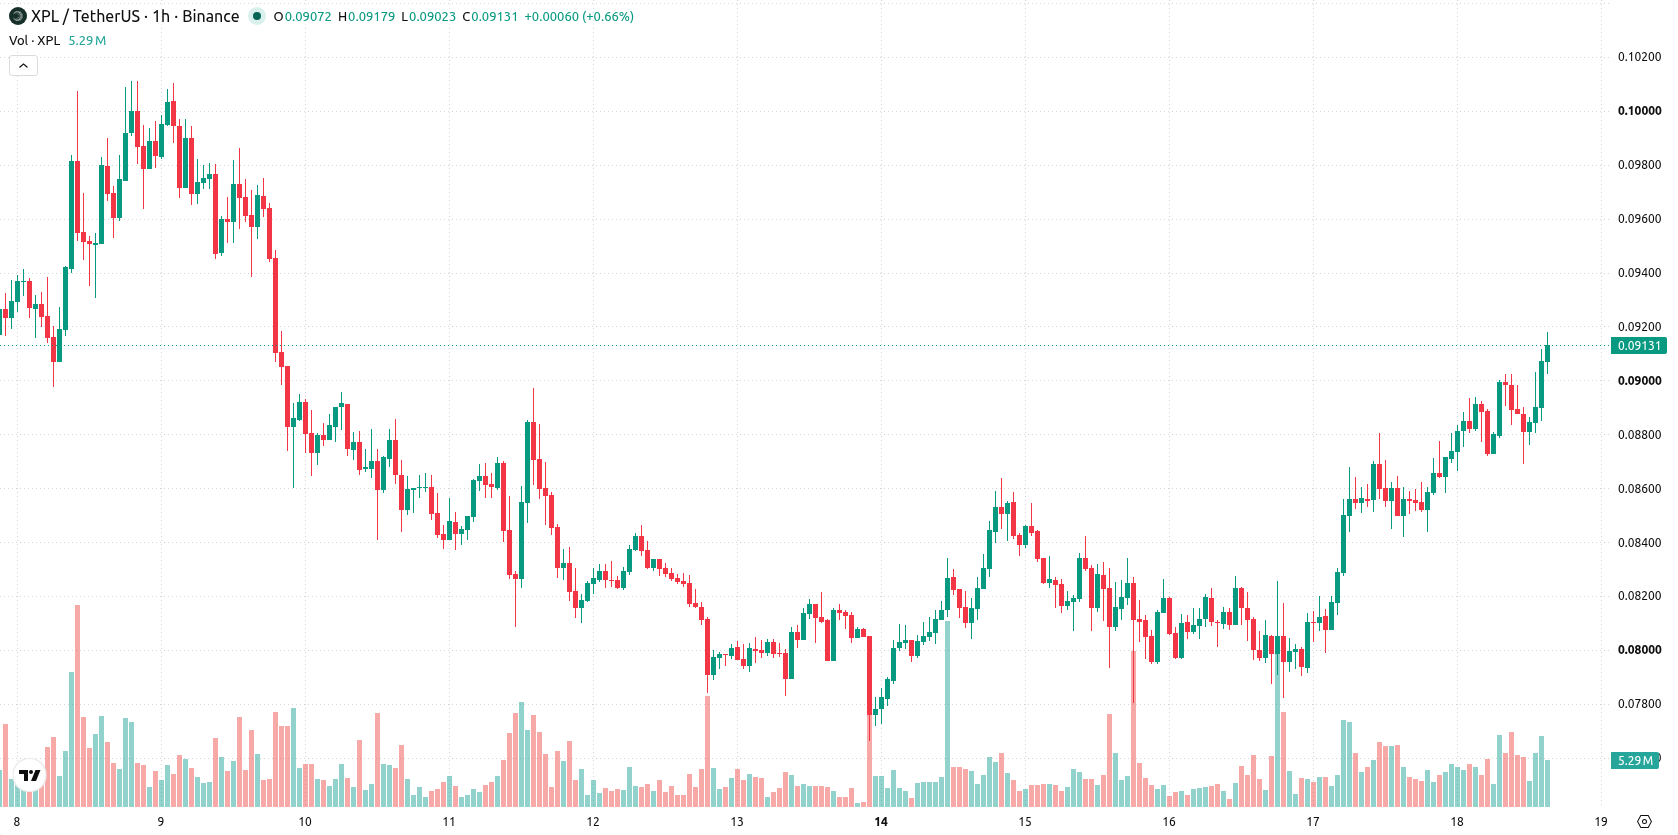
Plasma (XPL) is trading at $0.0913 after gaining 7.61% on the day, with price action above its key short- and medium-term moving averages while remaining below longer-term trend levels.
 0.0472
0.0505
Highlights
- XPL/USD trades above short- and medium-term moving averages but remains below the long-term average, maintaining a bearish broader trend.
- Momentum indicators are mixed with strong intraday buyer action and high volatility, but oscillator divergence indicates possible short-term exhaustion.
- Expected price range for the next 2 to 3 days is $0.0865 to $0.0939, with a very high probability of an upward move.
Bullish bias firming as technical ceilings limit momentum
On the XPL/USD h1 chart, price has moved above both the MA-20 at $0.0882 and the MA-50 at $0.085, with the long-term MA-200 overhead at $0.0936 serving as a major technical ceiling. The Ichimoku Kijun is providing immediate support at $0.0872, marking a key reversal or breakdown zone. Among momentum signals, MACD now registers a strong buy and ADX points to dominant bullish momentum, joined by confirmations from RSI (58.5) and CCI, while Stoch RSI is oversold—signaling the possibility of near-term upward moves. Bull/Bear Power confirms a strong buyer presence during the session, while the Awesome Oscillator remains neutral. A gap between today’s price and the previous close, combined with increased volatility and price near the daily high, highlight intraday buyer aggression. Nonetheless, with Stoch RSI oversold but other momentum readings firmly positive, the risk of short-term enthusiasm exhaustion may be approaching.
Range-bound trading likely as upside breakout probability climbs
Looking ahead to the next 2–3 days, XPL/USD is likely to trade within the expected band between $0.0865 and $0.0939, reflecting the typical volatility for the pair at current levels. The base case scenario is for sideways movement within this corridor. Should a bullish breakout occur, price could approach or exceed the upper bound at $0.0939, whereas a sustained move under the immediate Ichimoku Kijun support at $0.0872 would open the way to the lower end of the range at $0.0865. The probability of an upward move is rated as very high, with the risk of a downside break low at present.
Earlier, analysts noted that Plasma displayed conflicting momentum signals, calling for caution as upside potential was limited by long-term technical resistance. The latest analysis strengthens this outlook by highlighting that while immediate momentum is bullish, traders should closely monitor the $0.0936–$0.0939 region as a pivotal resistance zone for any potential breakout.






Latest Plasma News




-
 Afghanistan
-
 Albania
-
 Algeria
-
 Angola
-
 Argentina
-
 Armenia
-
 Australia
-
 Austria
-
 Azerbaijan
-
 Bahamas
-
 Bahrain
-
 Bangladesh
-
 Belarus
-
 Belgium
-
 Bolivia
-
 Botswana
-
 Brazil
-
 Brunei
-
 Bulgaria
-
 Cambodia
-
 Cameroon
-
 Canada
-
 Chile
-
 China
-
 Colombia
-
 Congo
-
 Costa Rica
-
 Cote d'Ivoire
-
 Croatia
-
 Cuba
-
 Cyprus
-
 Czechia
-
 DR Congo
-
 Denmark
-
 Dominican Republic
-
 Ecuador
-
 Egypt
-
 El Salvador
-
 Estonia
-
 Eswatini
-
 Ethiopia
-
 Finland
-
 France
-
 Georgia
-
 Germany
-
 Ghana
-
 Greece
-
 Haiti
-
 Hong Kong
-
 Hungary
-
 India
-
 Indonesia
-
 Iran, Islamic republic
-
 Iraq
-
 Ireland
-
 Israel
-
 Italy
-
 Jamaica
-
 Japan
-
 Jordan
-
 Kazakhstan
-
 Kenya
-
 Korea
-
 Kuwait
-
 Kyrgyzstan
-
 Laos
-
 Latvia
-
 Lebanon
-
 Lesotho
-
 Libya
-
 Lithuania
-
 Luxembourg
-
 Madagascar
-
 Malaysia
-
 Malta
-
 Mauritius
-
 Mexico
-
 Moldova
-
 Mongolia
-
 Montenegro
-
 Morocco
-
 Mozambique
-
 Myanmar
-
 Namibia
-
 Nepal
-
 Netherlands
-
 New Zealand
-
 Nigeria
-
 North Macedonia
-
 Norway
-
 Oman
-
 Pakistan
-
 Palestine
-
 Panama
-
 Papua New Guinea
-
 Paraguay
-
 Peru
-
 Philippines
-
 Poland
-
 Portugal
-
 Puerto Rico
-
 Qatar
-
 Reunion
-
 Romania
-
 Rwanda
-
 Saudi Arabia
-
 Serbia
-
 Singapore
-
 Slovakia
-
 Slovenia
-
 Somalia
-
 South Africa
-
 Spain
-
 Sri Lanka
-
 Sweden
-
 Switzerland
-
 Syria
-
 Taiwan
-
 Tajikistan
-
 Tanzania
-
 Thailand
-
 Trinidad and Tobago
-
 Tunisia
-
 Turkey
-
 UAE
-
 Uganda
-
 Ukraine
-
 United Kingdom
-
United States
-
 Uruguay
-
 Uzbekistan
-
 Venezuela
-
 Vietnam
-
 Yemen
-
 Zambia
-
 Zimbabwe
- Forex
- Crypto












