

Sei technical analysis: Resistance test at $0.052 faces overbought conditions

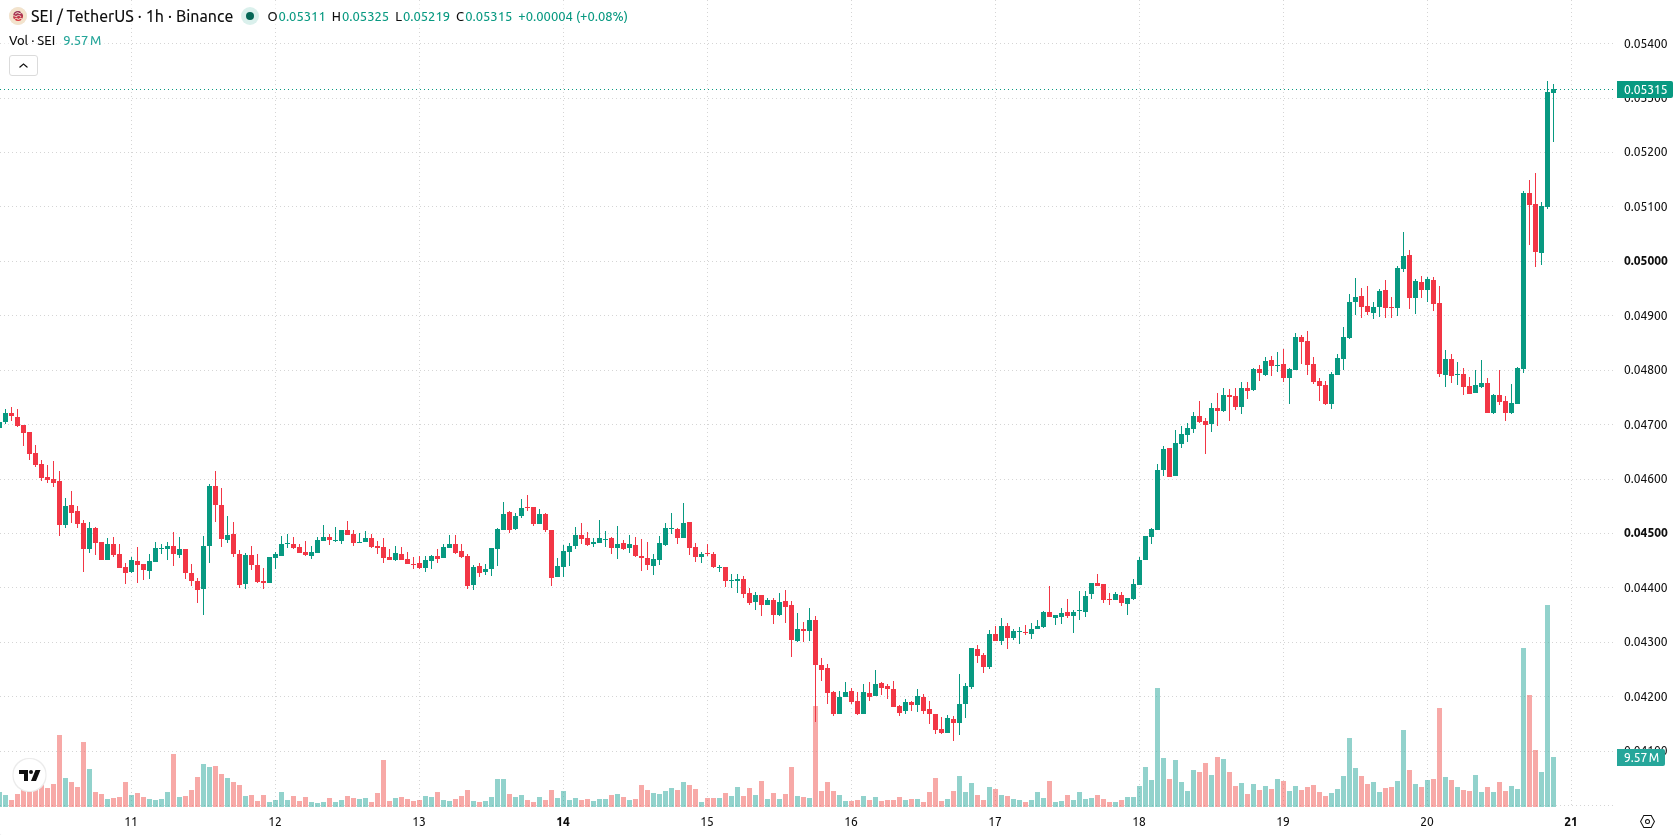
Sei (SEI) is trading at $0.0529, posting a daily gain of 7.31%. The asset is positioned above its key short- and medium-term moving averages, with price action maintaining strength near the session’s high.
 0.0715
0.0748
0.0715
0.0748
Highlights
- Market participation in Sei has increased due to greater technical momentum, derivatives trading, and new trading access developments.
- Expanded derivatives activity and innovation in trading channels have raised demand, supporting significant buyer interest in Sei.
- SEI/USD trades near $0.0529, with strong bullish technical signals and a very high probability of staying in the $0.0508 to $0.055 range over the next two to three days.
Market participation rises as derivatives inflows and innovations drive demand
Recent increases in technical momentum, derivatives activity, and the rollout of new trading developments have contributed to a surge in market participation for Sei, according to Newsbreak. The influx of derivatives trading and innovations in access channels have amplified demand dynamics, supporting notable buyer interest. Collectively, these factors have set the stage for elevated trading activity amid a backdrop of robust risk appetite among participants.
Buy signals and overbought readings cap upside near key resistance
On the h1 timeframe, SEI/USD is trading above both the MA-20 and MA-50, while the daily chart shows price remains below the MA-200. Immediate support is located at the Ichimoku Kijun level of $0.0495. Technical indicators reveal strong Buy signals from MACD and ADX, while RSI, Stoch RSI, and CCI all point to overbought conditions. Bull/Bear Power confirms buyer dominance in intraday momentum, and the Awesome Oscillator aligns with the prevailing uptrend.
Upside breakout favored as consolidation tightens amid robust momentum
Over the next two to three trading days, SEI/USD is expected to consolidate within the range of $0.0508 to $0.055. The probability of an upward breakout from this range is high given prevailing momentum, while the chance of a downside reversal remains low. The baseline scenario envisions further consolidation near current levels; a move above $0.055 would indicate renewed upward continuation, while a drop below $0.0495 could trigger a deeper pullback.
Earlier, analysts noted that Sei was experiencing a divergence between short-term bullish momentum and a lingering long-term bearish alignment. The current analysis not only strengthens this view with evidence of robust technical momentum and expanded derivatives activity, but also highlights the importance of monitoring for a potential decisive breakout above $0.055 as a signal for renewed upward continuation.










-
 Afghanistan
-
 Albania
-
 Algeria
-
 Angola
-
 Argentina
-
 Armenia
-
 Australia
-
 Austria
-
 Azerbaijan
-
 Bahamas
-
 Bahrain
-
 Bangladesh
-
 Belarus
-
 Belgium
-
 Bolivia
-
 Botswana
-
 Brazil
-
 Brunei
-
 Bulgaria
-
 Cambodia
-
 Cameroon
-
 Canada
-
 Chile
Chile
-
 China
China
-
 Colombia
-
 Congo
Congo
-
 Costa Rica
-
 Cote d'Ivoire
-
 Croatia
-
 Cuba
Cuba
-
 Cyprus
-
 Czechia
-
 DR Congo
-
 Denmark
-
 Dominican Republic
-
 Ecuador
-
 Egypt
Egypt
-
 El Salvador
-
 Estonia
-
 Eswatini
-
 Ethiopia
-
 Finland
-
 France
-
 Georgia
-
 Germany
-
 Ghana
Ghana
-
 Greece
-
 Haiti
Haiti
-
 Hong Kong
-
 Hungary
-
 India
India
-
 Indonesia
-
 Iran, Islamic republic
-
 Iraq
Iraq
-
 Ireland
-
 Israel
-
 Italy
Italy
-
 Jamaica
-
 Japan
Japan
-
 Jordan
-
 Kazakhstan
-
 Kenya
Kenya
-
 Korea
Korea
-
 Kuwait
-
 Kyrgyzstan
-
 Laos
Laos
-
 Latvia
-
 Lebanon
-
 Lesotho
-
 Libya
Libya
-
 Lithuania
-
 Luxembourg
-
 Madagascar
-
 Malaysia
-
 Malta
Malta
-
 Mauritius
-
 Mexico
-
 Moldova
-
 Mongolia
-
 Montenegro
-
 Morocco
-
 Mozambique
-
 Myanmar
-
 Namibia
-
 Nepal
Nepal
-
 Netherlands
-
 New Zealand
-
 Nigeria
-
 North Macedonia
-
 Norway
-
 Oman
Oman
-
 Pakistan
-
 Palestine
-
 Panama
-
 Papua New Guinea
-
 Paraguay
-
 Peru
Peru
-
 Philippines
-
 Poland
-
 Portugal
-
 Puerto Rico
-
 Qatar
Qatar
-
 Reunion
-
 Romania
-
 Rwanda
-
 Saudi Arabia
-
 Serbia
-
 Singapore
-
 Slovakia
-
 Slovenia
-
 Somalia
-
 South Africa
-
 Spain
Spain
-
 Sri Lanka
-
 Sweden
-
 Switzerland
-
 Syria
Syria
-
 Taiwan
-
 Tajikistan
-
 Tanzania
-
 Thailand
-
 Trinidad and Tobago
-
 Tunisia
-
 Turkey
-
 UAE
UAE
-
 Uganda
-
 Ukraine
-
 United Kingdom
-
United States
-
 Uruguay
-
 Uzbekistan
-
 Venezuela
-
 Vietnam
-
 Yemen
Yemen
-
 Zambia
-
 Zimbabwe
- Forex
- Crypto












