

Arbitrum drops nearly 10% after downside gap despite real-world asset surge

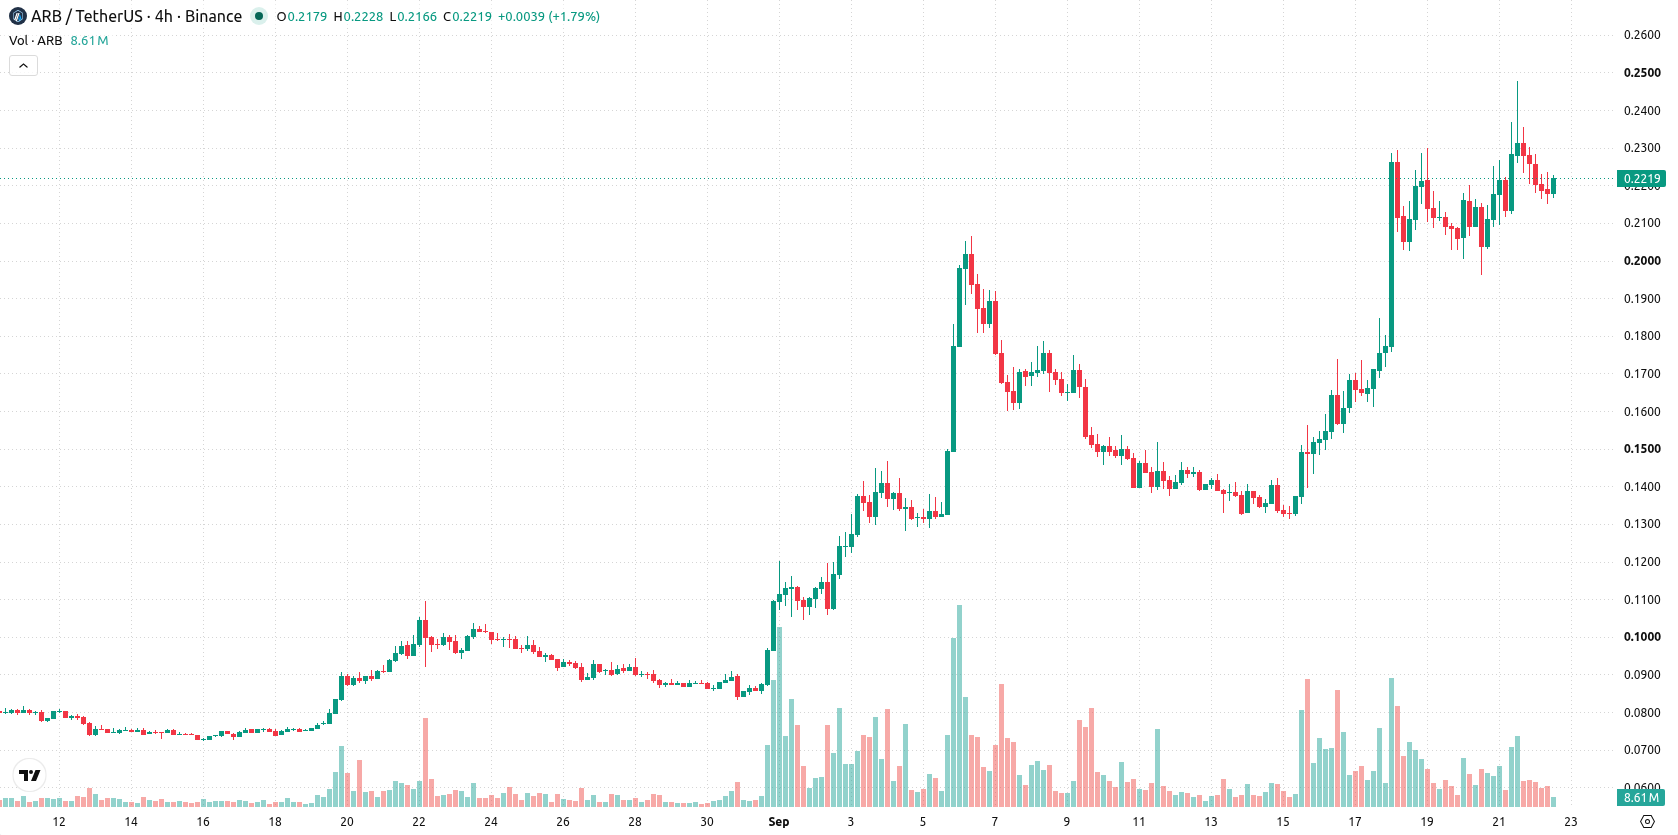
Arbitrum (ARB) dropped 9.83% after a downside gap, with the selloff unfolding even as recent network growth and increased real-world asset tokenization activity remain in focus. The decline is limited by the asset’s continued trading well above its 20-day, 50-day, and 200-day moving averages, pointing to persistent strength in the broader uptrend.
 0.1661
0.1786
Highlights
- Arbitrum added over $74 million in real-world asset market cap in a single week during September 2026 as tokenized treasuries and commodities expanded.
- September network revenue climbed to $5 million, about five times previous months, supported by increased activity after the Robinhood Chain launch.
- ARB/USD trades between $0.215 and $0.2283, with bullish momentum signals and an 80% probability of an upward move toward $0.2935 in the next five days.
On-chain asset gains and revenue surge as sellers remain active
Arbitrum, a layer-2 blockchain on Ethereum, recently recorded more than $74 million in real-world asset market cap growth in a single week in September 2026, reflecting an increase in tokenized assets like treasuries and commodities. The network’s September revenue reportedly rose to $5 million, approximately five times higher than earlier months, partially attributed to heightened activity following the Robinhood Chain launch. These developments have accompanied Arbitrum’s expanding role in supporting on-chain financial assets, though price action has remained under broader selling pressure.
Uptrend momentum faces overbought signals amid persistent volatility
ARB/USD is trading well above its 20-day, 50-day, and 200-day moving averages at $0.1652, $0.1175, and $0.1042, signaling sustained strength across short, medium, and long-term trends. The bullish alignment between the 50-day and 200-day averages supports the prevailing uptrend, with immediate levels defined by a near-term ceiling at $0.2283 and a floor at $0.215. Momentum remains robust: both the Moving Average Convergence Divergence (MACD) and the Average Directional Index (ADX) indicate buying pressure. The Relative Strength Index (RSI), Stochastic RSI, and Commodity Channel Index (CCI) all point to overbought conditions. Bull/Bear Power (BBP) is positive, showing buyers are dominating intraday momentum, while the Awesome Oscillator (AO) further supports the bullish setup. ARB/USD is down to $0.222, slipping 9.83% on the day after a downside gap of about 8.37%, now trading mid-range between $0.215 and $0.2283. Intraday volatility stands at 6.19%. The session tone is marked by pressure following the open, yet overall momentum signals remain bullish even as oscillators warn of stretched conditions.
Earlier, analysts noted that despite enhanced real-world asset integration, Arbitrum's price action was constrained by persistent selling pressure and consolidation. The latest data reinforce this narrative by highlighting robust network growth and rising revenues even as short-term volatility persists, making $0.215 a pivotal level to monitor for directional cues in the days ahead.






Latest Arbitrum News





-
 Afghanistan
-
 Albania
-
 Algeria
-
 Angola
-
 Argentina
-
 Armenia
-
 Australia
-
 Austria
-
 Azerbaijan
-
 Bahamas
-
 Bahrain
-
 Bangladesh
-
 Belarus
-
 Belgium
-
 Bolivia
-
 Botswana
-
 Brazil
-
 Brunei
-
 Bulgaria
-
 Cambodia
-
 Cameroon
-
 Canada
-
 Chile
-
 China
-
 Colombia
-
 Congo
-
 Costa Rica
-
 Cote d'Ivoire
-
 Croatia
-
 Cuba
-
 Cyprus
-
 Czechia
-
 DR Congo
-
 Denmark
-
 Dominican Republic
-
 Ecuador
-
 Egypt
-
 El Salvador
-
 Estonia
-
 Eswatini
-
 Ethiopia
-
 Finland
-
 France
-
 Georgia
-
 Germany
-
 Ghana
-
 Greece
-
 Haiti
-
 Hong Kong
-
 Hungary
-
 India
-
 Indonesia
-
 Iran, Islamic republic
-
 Iraq
-
 Ireland
-
 Israel
-
 Italy
-
 Jamaica
-
 Japan
-
 Jordan
-
 Kazakhstan
-
 Kenya
-
 Korea
-
 Kuwait
-
 Kyrgyzstan
-
 Laos
-
 Latvia
-
 Lebanon
-
 Lesotho
-
 Libya
-
 Lithuania
-
 Luxembourg
-
 Madagascar
-
 Malaysia
-
 Malta
-
 Mauritius
-
 Mexico
-
 Moldova
-
 Mongolia
-
 Montenegro
-
 Morocco
-
 Mozambique
-
 Myanmar
-
 Namibia
-
 Nepal
-
 Netherlands
-
 New Zealand
-
 Nigeria
-
 North Macedonia
-
 Norway
-
 Oman
-
 Pakistan
-
 Palestine
-
 Panama
-
 Papua New Guinea
-
 Paraguay
-
 Peru
-
 Philippines
-
 Poland
-
 Portugal
-
 Puerto Rico
-
 Qatar
-
 Reunion
-
 Romania
-
 Rwanda
-
 Saudi Arabia
-
 Serbia
-
 Singapore
-
 Slovakia
-
 Slovenia
-
 Somalia
-
 South Africa
-
 Spain
-
 Sri Lanka
-
 Sweden
-
 Switzerland
-
 Syria
-
 Taiwan
-
 Tajikistan
-
 Tanzania
-
 Thailand
-
 Trinidad and Tobago
-
 Tunisia
-
 Turkey
-
 UAE
-
 Uganda
-
 Ukraine
-
 United Kingdom
-
United States
-
 Uruguay
-
 Uzbekistan
-
 Venezuela
-
 Vietnam
-
 Yemen
-
 Zambia
-
 Zimbabwe
- Forex
- Crypto












