


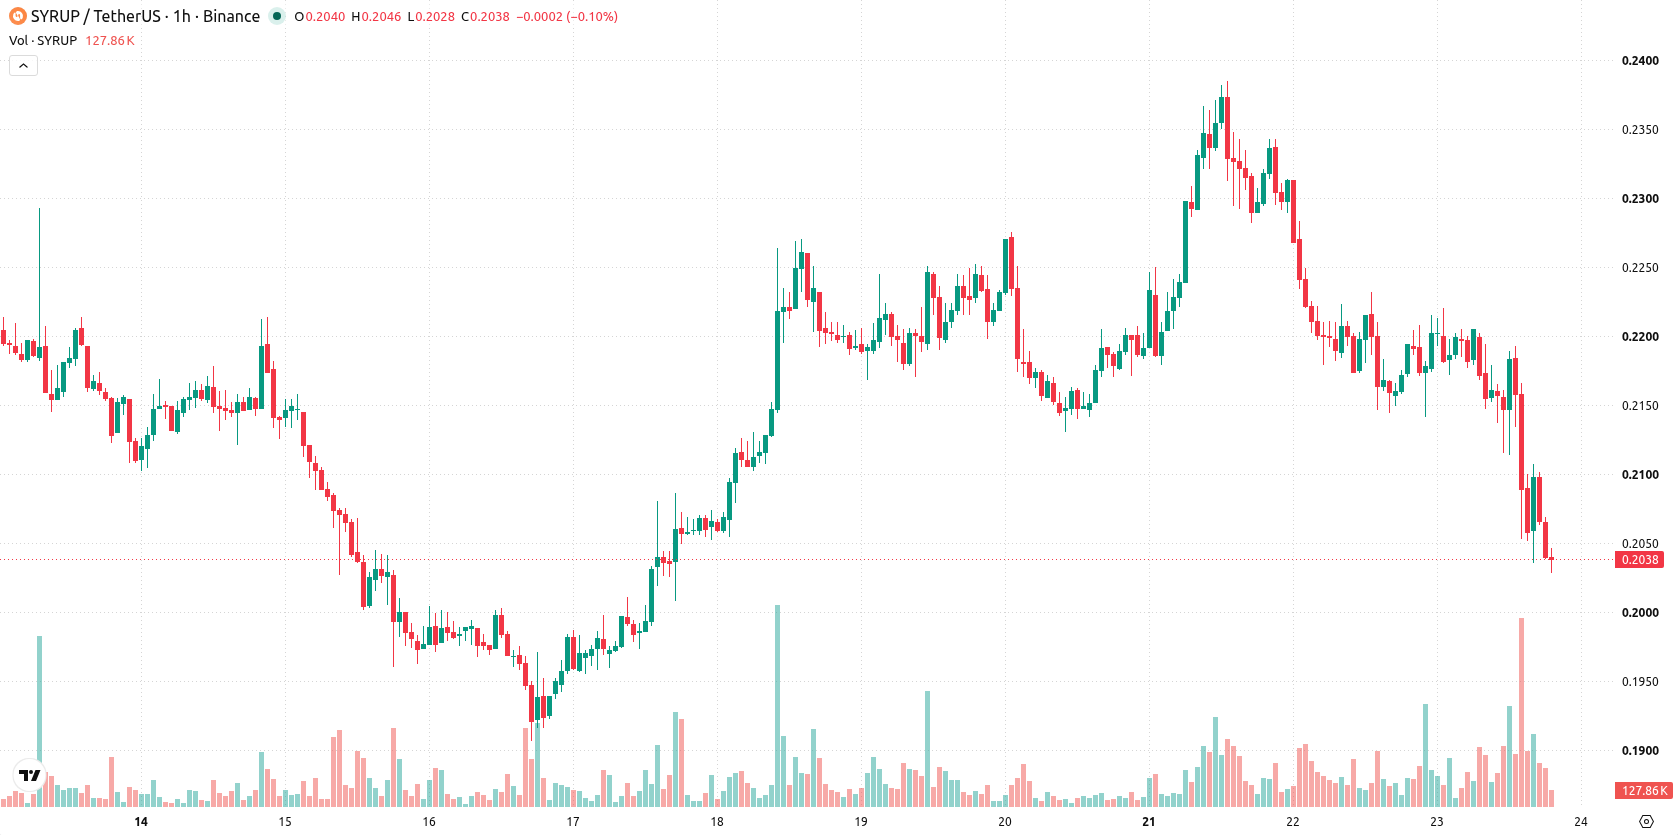
Maple (SYRUP) is trading at $0.2032 after falling 7.04% over the latest session. The asset remains below its key short- and medium-term moving averages but above its long-term average, indicating short-term pressure within a broader support context.
 0.1943
0.2706
Highlights
- SYRUP/USD trades below short- and medium-term moving averages, facing continued bearish pressure but remains above long-term support.
- Momentum and volatility indicators show strong seller dominance and technical weakness, with no positive divergence among signals.
- Price dropped 7.04% to $0.2032, expected to remain between $0.1936 and $0.2128 over the next 2 to 3 days unless key levels break.
Broad downside bias as technical barriers and momentum weaken
On the technical front, SYRUP is trading below the MA-20 at $0.2153 and the MA-50 at $0.2194, while still holding above the MA-200 at $0.1945. Immediate resistance is marked by the Ichimoku Kijun at $0.2128, with support seen at $0.1936. Momentum signals are negative — both MACD and ADX lean toward further downside, while RSI stands at 34.25 and the CCI is entrenched in oversold territory; Stochastic RSI is currently neutral. Bull/Bear Power and the Awesome Oscillator support a strong seller bias, with all key signals showing no divergence and reinforcing the prevailing downside momentum.
Bearish scenario intensifies amid heightened breakdown risk
In the short term, SYRUP is likely to remain in a volatility band between $0.1936 and $0.2128 over the next two to three sessions. The probability of an upward move is very low, while the risk of further declines is high. A bullish scenario would require a decisive breakout above $0.2128 resistance, but if price falls below $0.1936 support, further losses may follow.
Earlier, analysts noted that Maple was experiencing persistent bearish momentum, with technical indicators signaling continued downside pressure. The latest price action reinforces this outlook, and traders should closely monitor the $0.1936 support as a breach could signal further losses ahead.









-
 Afghanistan
-
 Albania
-
 Algeria
-
 Angola
-
 Argentina
-
 Armenia
-
 Australia
-
 Austria
-
 Azerbaijan
-
 Bahamas
-
 Bahrain
-
 Bangladesh
-
 Belarus
-
 Belgium
-
 Bolivia
-
 Botswana
-
 Brazil
-
 Brunei
-
 Bulgaria
-
 Cambodia
-
 Cameroon
-
 Canada
-
 Chile
-
 China
-
 Colombia
-
 Congo
-
 Costa Rica
-
 Cote d'Ivoire
-
 Croatia
-
 Cuba
-
 Cyprus
-
 Czechia
-
 DR Congo
-
 Denmark
-
 Dominican Republic
-
 Ecuador
-
 Egypt
-
 El Salvador
-
 Estonia
-
 Eswatini
-
 Ethiopia
-
 Finland
-
 France
-
 Georgia
-
 Germany
-
 Ghana
-
 Greece
-
 Haiti
-
 Hong Kong
-
 Hungary
-
 India
-
 Indonesia
-
 Iran, Islamic republic
-
 Iraq
-
 Ireland
-
 Israel
-
 Italy
-
 Jamaica
-
 Japan
-
 Jordan
-
 Kazakhstan
-
 Kenya
-
 Korea
-
 Kuwait
-
 Kyrgyzstan
-
 Laos
-
 Latvia
-
 Lebanon
-
 Lesotho
-
 Libya
-
 Lithuania
-
 Luxembourg
-
 Madagascar
-
 Malaysia
-
 Malta
-
 Mauritius
-
 Mexico
-
 Moldova
-
 Mongolia
-
 Montenegro
-
 Morocco
-
 Mozambique
-
 Myanmar
-
 Namibia
-
 Nepal
-
 Netherlands
-
 New Zealand
-
 Nigeria
-
 North Macedonia
-
 Norway
-
 Oman
-
 Pakistan
-
 Palestine
-
 Panama
-
 Papua New Guinea
-
 Paraguay
-
 Peru
-
 Philippines
-
 Poland
-
 Portugal
-
 Puerto Rico
-
 Qatar
-
 Reunion
-
 Romania
-
 Rwanda
-
 Saudi Arabia
-
 Serbia
-
 Singapore
-
 Slovakia
-
 Slovenia
-
 Somalia
-
 South Africa
-
 Spain
-
 Sri Lanka
-
 Sweden
-
 Switzerland
-
 Syria
-
 Taiwan
-
 Tajikistan
-
 Tanzania
-
 Thailand
-
 Trinidad and Tobago
-
 Tunisia
-
 Turkey
-
 UAE
-
 Uganda
-
 Ukraine
-
 United Kingdom
-
United States
-
 Uruguay
-
 Uzbekistan
-
 Venezuela
-
 Vietnam
-
 Yemen
-
 Zambia
-
 Zimbabwe
- Forex
- Crypto












