

Curve falls over 9% as short-term selling pressure intensifies

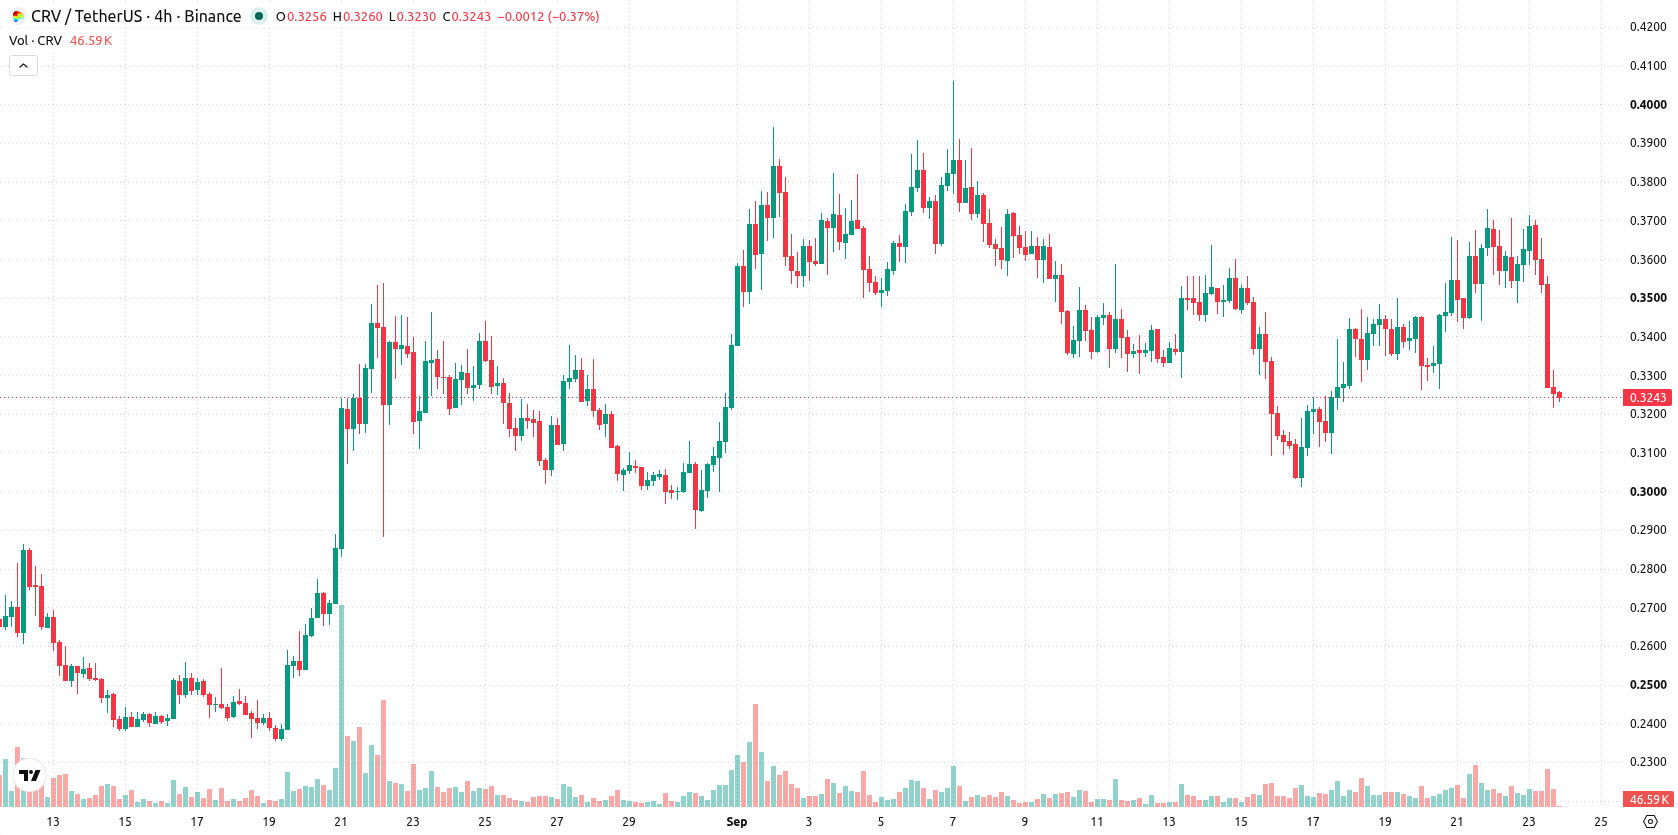
Curve (CRV) dropped 9.13% as heavy intraday volatility and strong short-term selling pressure drove the move. The downside was supported by the price trading below its 20-day moving average, even as medium- and long-term trend support remains intact.
 0.3432
0.3996
0.3432
0.3996
Highlights
- CRV/USD is below its 20-day average but holds above longer-term moving averages, showing short-term pressure yet medium-term trend support.
- Technical indicators are mixed, with strong upward momentum signals conflicting with short-term overbought oscillators and high daily volatility of 15.45%.
- The expected five-day range is $0.2928 to $0.381, with an 80% likelihood of an upward move and consolidation near current levels.
Divergent momentum signals as price tests key technical levels
CRV/USD currently trades below its 20-day moving average at $0.3501 but remains above the 50-day at $0.3078 and the 200-day at $0.2432, indicating short-term selling pressure with medium- and long-term trend support. Near-term resistance sits at the Ichimoku Kijun level of $0.3481, with support at today's low of $0.3216. The bullish alignment between the 50-day and 200-day moving averages reinforces the longer-term trend. Momentum signals are mixed: MACD and ADX suggest strong upward momentum, the RSI is in neutral-to-bullish territory, while the Stochastic RSI signals short-term overbought conditions. BBP is positive at 0.0238, showing intraday buyer dominance, with CCI and AO neutral. The price is currently positioned near the session low, and daily volatility amplitude is high at 15.45%, indicating notable downside pressure intraday. Divergent oscillator signals highlight a tug-of-war between short-term sellers and longer-term upside momentum.
Earlier, analysts noted that Curve’s technical structure had shifted toward sustained downside risk amid persistent selling pressure. The current review adds a new dimension, highlighting that while short-term volatility persists, a bullish breakout above $0.3481 remains a key level to watch for a potential upside reversal in the coming days.










-
 Afghanistan
-
 Albania
-
 Algeria
-
 Angola
-
 Argentina
-
 Armenia
-
 Australia
-
 Austria
-
 Azerbaijan
-
 Bahamas
-
 Bahrain
-
 Bangladesh
-
 Belarus
-
 Belgium
-
 Bolivia
-
 Botswana
-
 Brazil
-
 Brunei
-
 Bulgaria
-
 Cambodia
-
 Cameroon
-
 Canada
-
 Chile
Chile
-
 China
China
-
 Colombia
-
 Congo
Congo
-
 Costa Rica
-
 Cote d'Ivoire
-
 Croatia
-
 Cuba
Cuba
-
 Cyprus
-
 Czechia
-
 DR Congo
-
 Denmark
-
 Dominican Republic
-
 Ecuador
-
 Egypt
Egypt
-
 El Salvador
-
 Estonia
-
 Eswatini
-
 Ethiopia
-
 Finland
-
 France
-
 Georgia
-
 Germany
-
 Ghana
Ghana
-
 Greece
-
 Haiti
Haiti
-
 Hong Kong
-
 Hungary
-
 India
India
-
 Indonesia
-
 Iran, Islamic republic
-
 Iraq
Iraq
-
 Ireland
-
 Israel
-
 Italy
Italy
-
 Jamaica
-
 Japan
Japan
-
 Jordan
-
 Kazakhstan
-
 Kenya
Kenya
-
 Korea
Korea
-
 Kuwait
-
 Kyrgyzstan
-
 Laos
Laos
-
 Latvia
-
 Lebanon
-
 Lesotho
-
 Libya
Libya
-
 Lithuania
-
 Luxembourg
-
 Madagascar
-
 Malaysia
-
 Malta
Malta
-
 Mauritius
-
 Mexico
-
 Moldova
-
 Mongolia
-
 Montenegro
-
 Morocco
-
 Mozambique
-
 Myanmar
-
 Namibia
-
 Nepal
Nepal
-
 Netherlands
-
 New Zealand
-
 Nigeria
-
 North Macedonia
-
 Norway
-
 Oman
Oman
-
 Pakistan
-
 Palestine
-
 Panama
-
 Papua New Guinea
-
 Paraguay
-
 Peru
Peru
-
 Philippines
-
 Poland
-
 Portugal
-
 Puerto Rico
-
 Qatar
Qatar
-
 Reunion
-
 Romania
-
 Rwanda
-
 Saudi Arabia
-
 Serbia
-
 Singapore
-
 Slovakia
-
 Slovenia
-
 Somalia
-
 South Africa
-
 Spain
Spain
-
 Sri Lanka
-
 Sweden
-
 Switzerland
-
 Syria
Syria
-
 Taiwan
-
 Tajikistan
-
 Tanzania
-
 Thailand
-
 Trinidad and Tobago
-
 Tunisia
-
 Turkey
-
 UAE
UAE
-
 Uganda
-
 Ukraine
-
 United Kingdom
-
United States
-
 Uruguay
-
 Uzbekistan
-
 Venezuela
-
 Vietnam
-
 Yemen
Yemen
-
 Zambia
-
 Zimbabwe
- Forex
- Crypto












