

Kaia drops more than 10% after sustained selling pressure and overbought signals

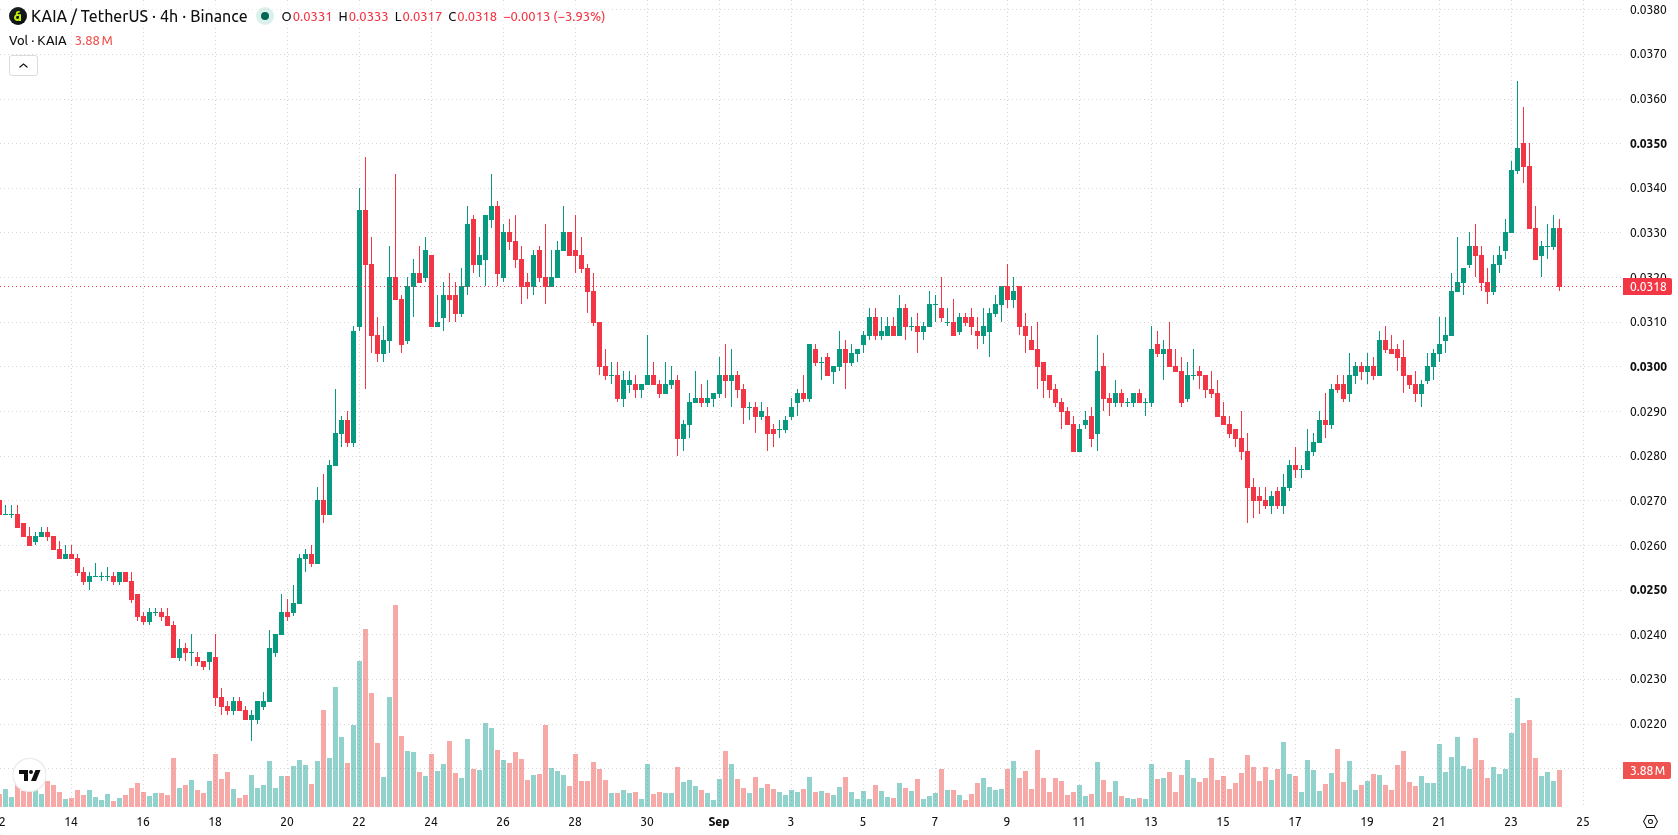
Kaia (KAIA) dropped 10.17% under sustained selling pressure, as bearish momentum outweighed any fresh market drivers. The decline is supported by intraday weakness and the presence of overbought technical signals, even as the pair remains above short- and medium-term moving averages.
 0.035
0.0357
Highlights
- KAIA/USD trades above short- and medium-term moving averages but remains below the 200-day average, indicating short-term bullish momentum in a longer-term bearish trend.
- Technical indicators present mixed signals: MACD and ADX show strength while RSI, Stochastic RSI, and CCI warn of overbought conditions and possible consolidation.
- The next five-day trading range is expected at $0.0279 to $0.0371, with near-term support at $0.0316 and resistance at $0.0324.
Mixed signals as short-term strength meets overbought warning
KAIA/USD is trading above its 20-day and 50-day moving averages at $0.0301 and $0.0289, respectively, but remains below the 200-day moving average at $0.0393. This configuration indicates bullish momentum over the short- and medium-term timeframes, while the long-term structure still aligns bearishly. Immediate support sits at $0.0316 (Ichimoku Kijun) and resistance is identified at $0.0324 (today’s low). Momentum indicators are mixed: both MACD and ADX provide a Buy signal, reflecting underlying strength, but RSI, Stochastic RSI, and CCI are in overbought territory, suggesting heightened risk of consolidation or a pullback. Bull/Bear Power (BBP) at 0.0058 points to intraday buyer dominance, while the Awesome Oscillator is neutral. The current session has been characterized by a 3.40% volatility and sustained pressure from the open.
Earlier, analysts noted that Kaia was exhibiting near-term bullish momentum while warning of potential overbought risks amid elevated volatility. The current pullback highlights the importance of closely monitoring the $0.0316 support zone, as a decisive move below this level could open the way for a deeper retracement in the days ahead.










-
 Afghanistan
-
 Albania
-
 Algeria
-
 Angola
-
 Argentina
-
 Armenia
-
 Australia
-
 Austria
-
 Azerbaijan
-
 Bahamas
-
 Bahrain
-
 Bangladesh
-
 Belarus
-
 Belgium
-
 Bolivia
-
 Botswana
-
 Brazil
-
 Brunei
-
 Bulgaria
-
 Cambodia
-
 Cameroon
-
 Canada
-
 Chile
-
 China
-
 Colombia
-
 Congo
-
 Costa Rica
-
 Cote d'Ivoire
-
 Croatia
-
 Cuba
-
 Cyprus
-
 Czechia
-
 DR Congo
-
 Denmark
-
 Dominican Republic
-
 Ecuador
-
 Egypt
-
 El Salvador
-
 Estonia
-
 Eswatini
-
 Ethiopia
-
 Finland
-
 France
-
 Georgia
-
 Germany
-
 Ghana
-
 Greece
-
 Haiti
-
 Hong Kong
-
 Hungary
-
 India
-
 Indonesia
-
 Iran, Islamic republic
-
 Iraq
-
 Ireland
-
 Israel
-
 Italy
-
 Jamaica
-
 Japan
-
 Jordan
-
 Kazakhstan
-
 Kenya
-
 Korea
-
 Kuwait
-
 Kyrgyzstan
-
 Laos
-
 Latvia
-
 Lebanon
-
 Lesotho
-
 Libya
-
 Lithuania
-
 Luxembourg
-
 Madagascar
-
 Malaysia
-
 Malta
-
 Mauritius
-
 Mexico
-
 Moldova
-
 Mongolia
-
 Montenegro
-
 Morocco
-
 Mozambique
-
 Myanmar
-
 Namibia
-
 Nepal
-
 Netherlands
-
 New Zealand
-
 Nigeria
-
 North Macedonia
-
 Norway
-
 Oman
-
 Pakistan
-
 Palestine
-
 Panama
-
 Papua New Guinea
-
 Paraguay
-
 Peru
-
 Philippines
-
 Poland
-
 Portugal
-
 Puerto Rico
-
 Qatar
-
 Reunion
-
 Romania
-
 Rwanda
-
 Saudi Arabia
-
 Serbia
-
 Singapore
-
 Slovakia
-
 Slovenia
-
 Somalia
-
 South Africa
-
 Spain
-
 Sri Lanka
-
 Sweden
-
 Switzerland
-
 Syria
-
 Taiwan
-
 Tajikistan
-
 Tanzania
-
 Thailand
-
 Trinidad and Tobago
-
 Tunisia
-
 Turkey
-
 UAE
-
 Uganda
-
 Ukraine
-
 United Kingdom
-
United States
-
 Uruguay
-
 Uzbekistan
-
 Venezuela
-
 Vietnam
-
 Yemen
-
 Zambia
-
 Zimbabwe
- Forex
- Crypto












