

Why is Maple falling today? Breakdown and support levels to watch

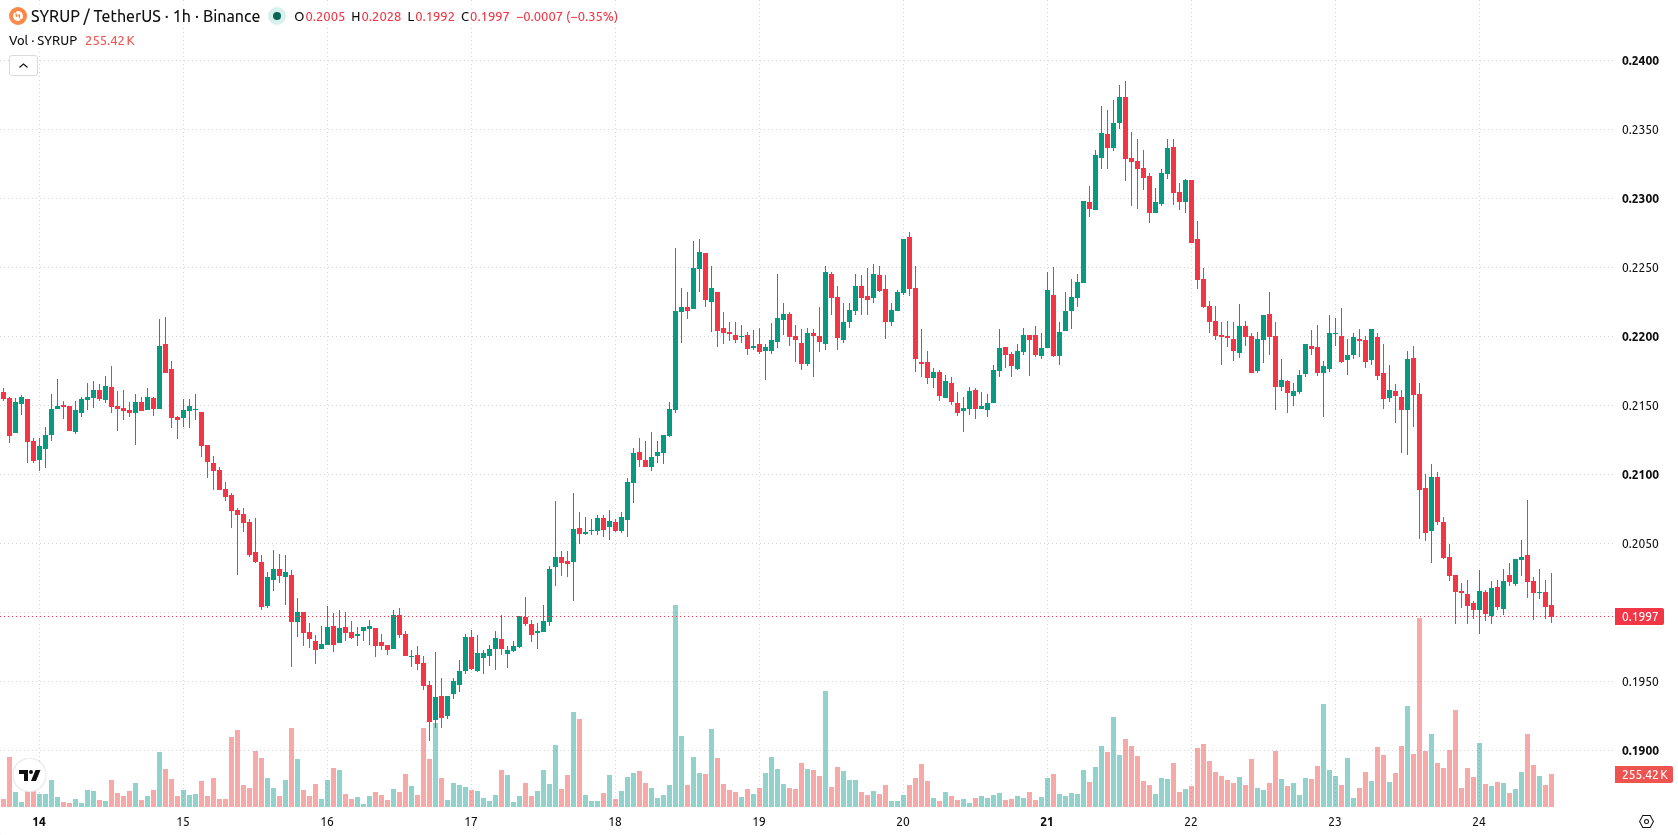
Maple (SYRUP) is trading at $0.2, down 7.24% on the day and lingering near the session low. The asset remains below its main short- and medium-term moving averages, indicating persistent downside momentum relative to recent averages.
 0.2011
0.2706
0.2011
0.2706
Highlights
- SYRUP/USD trades below short- and medium-term moving averages but stays above long-term support, indicating ongoing selling pressure.
- Momentum indicators deliver strong sell signals, with negative movement supported by MACD and ADX, as price drops 7.24%.
- Expected price range for the next 2 to 3 sessions is $0.1912 to $0.2189, with a high likelihood of further declines unless resistance at $0.2089 is cleared.
Diverging momentum signals as firm sell bias meets neutral oscillators
SYRUP is trading below the MA-20 ($0.2024) and MA-50 ($0.2113) on the hourly chart, while still holding above the MA-200 ($0.1945) on the daily chart. The Ichimoku Kijun level at $0.2089 marks immediate resistance. Momentum signals are strongly negative: both MACD and ADX indicate a firm sell setup. RSI at 37.37 suggests bearish momentum, though not extreme, while Stochastic RSI and CCI are neutral, reflecting indecision on oversold conditions. Bull/Bear Power confirms seller dominance intraday, while the Awesome Oscillator remains neutral, offering no additional trend confirmation. The price recently broke down to $0.2 amid high volatility, closing the session near its daily low with a 0.0154 gap down. Divergence between some neutral oscillators and strong sell signals hints at the potential for brief reactive moves, though the overall technical bias is weak.
Further declines likely as reversal risks remain minimal
For the next 2–3 sessions, the expected price range for Maple is $0.1912 to $0.2189, reflecting its typical volatility band. The likelihood of an upward move is very low, with strong probability favoring further declines and making a reversal unlikely in the short term. The baseline scenario sees price remaining capped within a horizontal consolidation corridor; a bullish breakout would require a move above $0.2089 resistance, while a drop below $0.1945 would confirm a bearish continuation.
Earlier, analysts noted that Maple was experiencing sustained bearish momentum, with technical indicators pointing to continued downside pressure. Current trading reinforces this outlook, and traders should monitor the $0.1945 support level closely for signals of a potential further breakdown.










-
 Afghanistan
-
 Albania
-
 Algeria
-
 Angola
-
 Argentina
-
 Armenia
-
 Australia
-
 Austria
-
 Azerbaijan
-
 Bahamas
-
 Bahrain
-
 Bangladesh
-
 Belarus
-
 Belgium
-
 Bolivia
-
 Botswana
-
 Brazil
-
 Brunei
-
 Bulgaria
-
 Cambodia
-
 Cameroon
-
 Canada
-
 Chile
Chile
-
 China
China
-
 Colombia
-
 Congo
Congo
-
 Costa Rica
-
 Cote d'Ivoire
-
 Croatia
-
 Cuba
Cuba
-
 Cyprus
-
 Czechia
-
 DR Congo
-
 Denmark
-
 Dominican Republic
-
 Ecuador
-
 Egypt
Egypt
-
 El Salvador
-
 Estonia
-
 Eswatini
-
 Ethiopia
-
 Finland
-
 France
-
 Georgia
-
 Germany
-
 Ghana
Ghana
-
 Greece
-
 Haiti
Haiti
-
 Hong Kong
-
 Hungary
-
 India
India
-
 Indonesia
-
 Iran, Islamic republic
-
 Iraq
Iraq
-
 Ireland
-
 Israel
-
 Italy
Italy
-
 Jamaica
-
 Japan
Japan
-
 Jordan
-
 Kazakhstan
-
 Kenya
Kenya
-
 Korea
Korea
-
 Kuwait
-
 Kyrgyzstan
-
 Laos
Laos
-
 Latvia
-
 Lebanon
-
 Lesotho
-
 Libya
Libya
-
 Lithuania
-
 Luxembourg
-
 Madagascar
-
 Malaysia
-
 Malta
Malta
-
 Mauritius
-
 Mexico
-
 Moldova
-
 Mongolia
-
 Montenegro
-
 Morocco
-
 Mozambique
-
 Myanmar
-
 Namibia
-
 Nepal
Nepal
-
 Netherlands
-
 New Zealand
-
 Nigeria
-
 North Macedonia
-
 Norway
-
 Oman
Oman
-
 Pakistan
-
 Palestine
-
 Panama
-
 Papua New Guinea
-
 Paraguay
-
 Peru
Peru
-
 Philippines
-
 Poland
-
 Portugal
-
 Puerto Rico
-
 Qatar
Qatar
-
 Reunion
-
 Romania
-
 Rwanda
-
 Saudi Arabia
-
 Serbia
-
 Singapore
-
 Slovakia
-
 Slovenia
-
 Somalia
-
 South Africa
-
 Spain
Spain
-
 Sri Lanka
-
 Sweden
-
 Switzerland
-
 Syria
Syria
-
 Taiwan
-
 Tajikistan
-
 Tanzania
-
 Thailand
-
 Trinidad and Tobago
-
 Tunisia
-
 Turkey
-
 UAE
UAE
-
 Uganda
-
 Ukraine
-
 United Kingdom
-
United States
-
 Uruguay
-
 Uzbekistan
-
 Venezuela
-
 Vietnam
-
 Yemen
Yemen
-
 Zambia
-
 Zimbabwe
- Forex
- Crypto












