

Why is Ethereum flat today? ETF inflows and support levels to watch

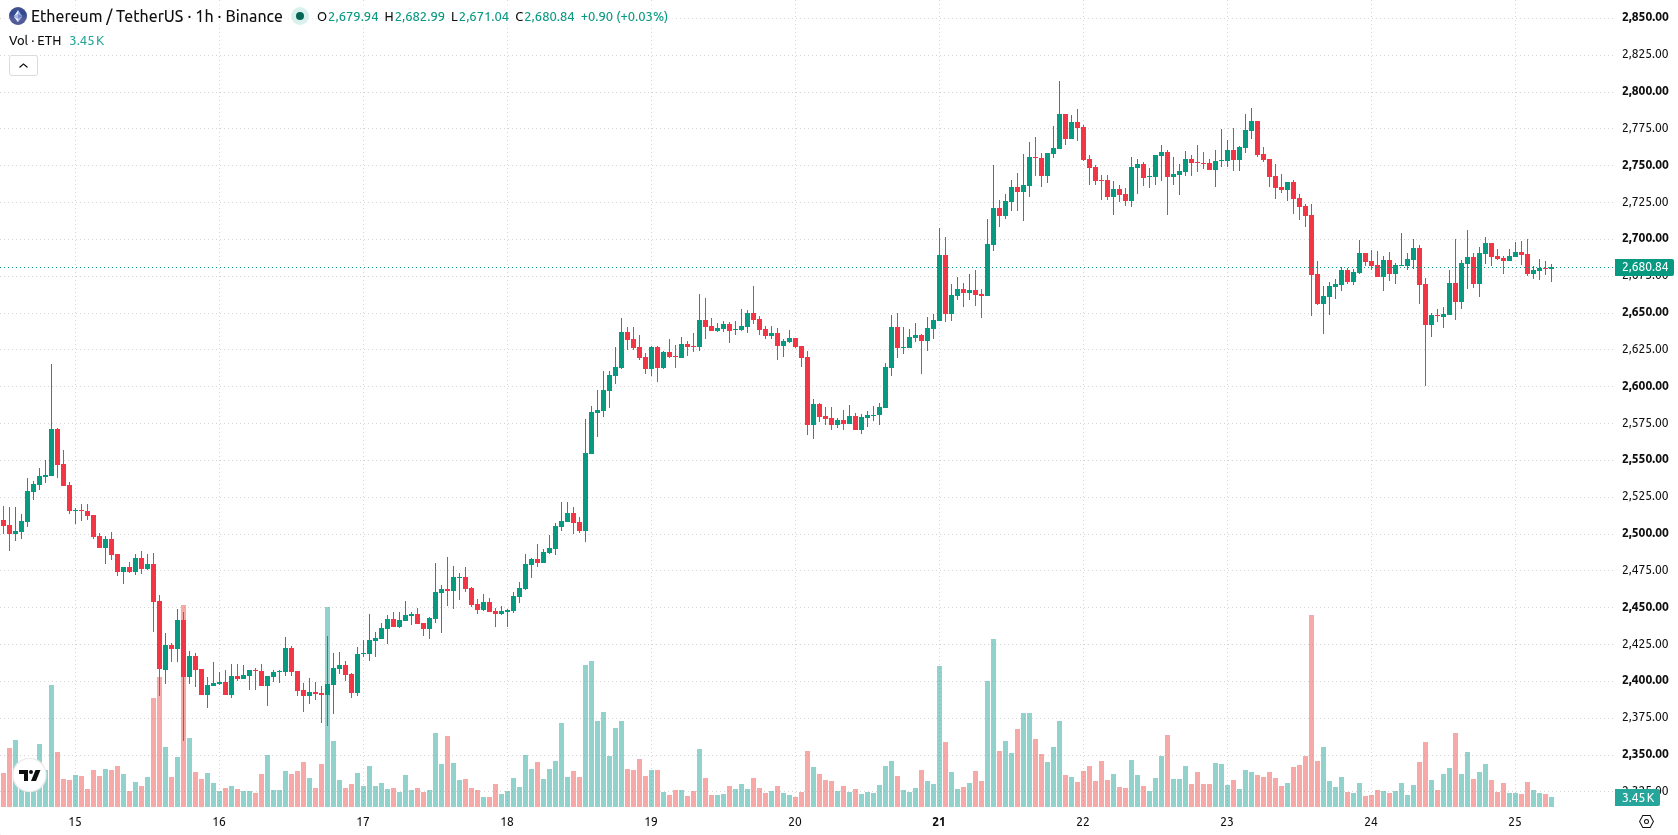
Ethereum (ETH) is trading at $2,682.03, narrowly lower on the day within a tight range. The token remains above its key moving averages on the daily chart but has slipped below its short-term hourly averages.
 2446.27
2538.52
Highlights
- BlackRock's iShares Ethereum Trust reported $50.8 million in net inflows on September 24, 2026, capturing nearly half of all US spot Ethereum ETF flows for that day.
- Cumulative inflows for ETHA climbed above $13 billion as US Ethereum ETFs attracted continued allocations through regulated structures.
- ETH/USD trades inside a projected range of $2,627 to $2,847, with technicals indicating sideways movement and a greater probability of further decline.
Institutional ETF inflows drive US Ethereum market expansion
BlackRock's iShares Ethereum Trust (ETHA) recorded $50.8 million in net inflows on September 24, 2026, capturing nearly half of all US spot Ethereum ETF flows for that day and pushing cumulative inflows above $13 billion, according to Cryptobriefing. Such sizable allocations from institutional channels directly expand Ethereum's exposure and liquidity, supporting its role in broader market portfolios. Additional data from Cryptobriefing showed total US Ethereum ETF inflows reached $105 million the previous day, with ETHA leading contributions, highlighting continued investor engagement through regulated vehicles.
Mixed momentum as support holds but indicators diverge
On the hourly chart, ETH trades above the MA-20 but remains below the MA-50, while standing firmly above the MA-200 on the daily timeframe. The Ichimoku Kijun level at $2,653 acts as immediate support. Among indicators, MACD points to sustained selling pressure, ADX is neutral, and the RSI reads 47.71, suggesting a bias towards selling. Stoch RSI is oversold, CCI is neutral, and Bull/Bear Power shows intraday buyer dominance, highlighting a divergence between momentum and oscillators and indicating short-term indecision.
Downside risk favored as range persists with low breakout odds
In the short term, the projected price range for ETH/USD is $2,627 to $2,847. There is a 22% probability of an upward breakout, while a downward move is statistically favored. The baseline scenario is for continued sideways trading within key support and resistance levels. An upside break would be signaled by price moving above resistance, while a fall below immediate support could lead to further declines.
Previously it was reported that large onchain transfers from Bitget-linked wallets raised questions about exchange security and user withdrawal activity. With Ethereum now drawing sustained institutional inflows through US spot ETFs and trading in a narrowly defined range, market participants should closely monitor for any unusual wallet activity or ETF flow anomalies as potential catalysts for a decisive breakout or breakdown.










-
 Afghanistan
-
 Albania
-
 Algeria
-
 Angola
-
 Argentina
-
 Armenia
-
 Australia
-
 Austria
-
 Azerbaijan
-
 Bahamas
-
 Bahrain
-
 Bangladesh
-
 Belarus
-
 Belgium
-
 Bolivia
-
 Botswana
-
 Brazil
-
 Brunei
-
 Bulgaria
-
 Cambodia
-
 Cameroon
-
 Canada
-
 Chile
-
 China
-
 Colombia
-
 Congo
-
 Costa Rica
-
 Cote d'Ivoire
-
 Croatia
-
 Cuba
-
 Cyprus
-
 Czechia
-
 DR Congo
-
 Denmark
-
 Dominican Republic
-
 Ecuador
-
 Egypt
-
 El Salvador
-
 Estonia
-
 Eswatini
-
 Ethiopia
-
 Finland
-
 France
-
 Georgia
-
 Germany
-
 Ghana
-
 Greece
-
 Haiti
-
 Hong Kong
-
 Hungary
-
 India
-
 Indonesia
-
 Iran, Islamic republic
-
 Iraq
-
 Ireland
-
 Israel
-
 Italy
-
 Jamaica
-
 Japan
-
 Jordan
-
 Kazakhstan
-
 Kenya
-
 Korea
-
 Kuwait
-
 Kyrgyzstan
-
 Laos
-
 Latvia
-
 Lebanon
-
 Lesotho
-
 Libya
-
 Lithuania
-
 Luxembourg
-
 Madagascar
-
 Malaysia
-
 Malta
-
 Mauritius
-
 Mexico
-
 Moldova
-
 Mongolia
-
 Montenegro
-
 Morocco
-
 Mozambique
-
 Myanmar
-
 Namibia
-
 Nepal
-
 Netherlands
-
 New Zealand
-
 Nigeria
-
 North Macedonia
-
 Norway
-
 Oman
-
 Pakistan
-
 Palestine
-
 Panama
-
 Papua New Guinea
-
 Paraguay
-
 Peru
-
 Philippines
-
 Poland
-
 Portugal
-
 Puerto Rico
-
 Qatar
-
 Reunion
-
 Romania
-
 Rwanda
-
 Saudi Arabia
-
 Serbia
-
 Singapore
-
 Slovakia
-
 Slovenia
-
 Somalia
-
 South Africa
-
 Spain
-
 Sri Lanka
-
 Sweden
-
 Switzerland
-
 Syria
-
 Taiwan
-
 Tajikistan
-
 Tanzania
-
 Thailand
-
 Trinidad and Tobago
-
 Tunisia
-
 Turkey
-
 UAE
-
 Uganda
-
 Ukraine
-
 United Kingdom
-
United States
-
 Uruguay
-
 Uzbekistan
-
 Venezuela
-
 Vietnam
-
 Yemen
-
 Zambia
-
 Zimbabwe
- Forex
- Crypto












