

Can decentralized network migration spark further gains for The Graph?

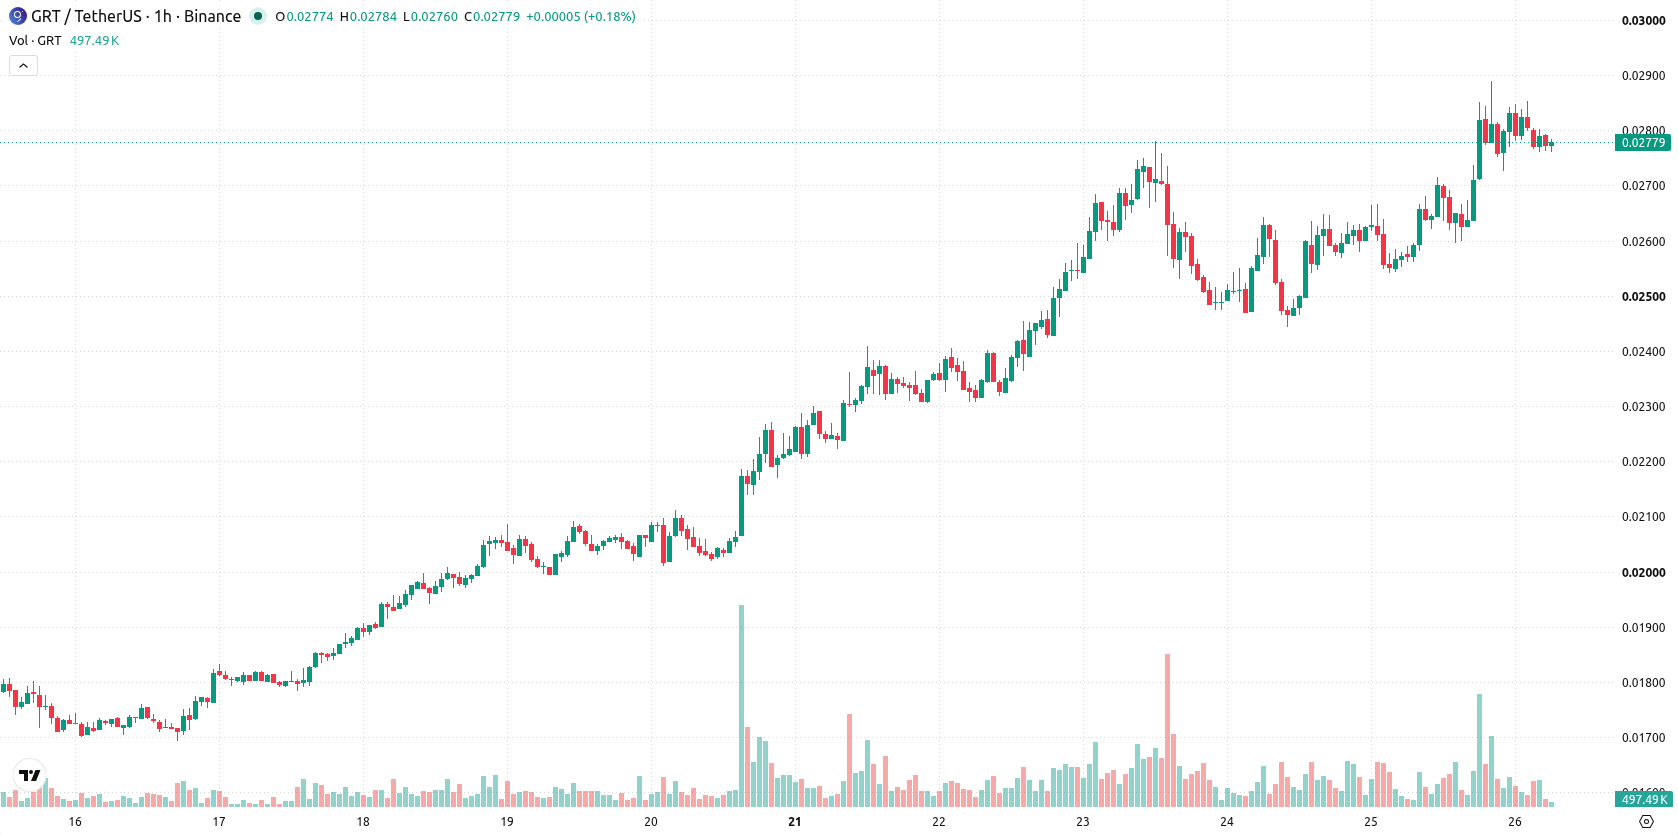
The Graph (GRT) is trading at $0.02771, up 7.07% for the session, and currently sits above its key moving averages. Price action remains near the lower end of the daily range amid moderate volatility.
 0.02056
0.02314000
Highlights
- The Graph will move all Subgraph Studio traffic to its decentralized network by October 8, 2026, starting with BNB Smart Chain and Polygon.
- This transition aims to increase GRT token usage, attract new demand, and strengthen the project’s decentralized economic model.
- GRT/USD trades with strong bullish momentum and is expected to consolidate between $0.0257445 and $0.0296755, with a 75% probability of further upside.
Decentralization push to boost GRT demand as migration advances
The Graph is progressing with its strategy to migrate all Subgraph Studio traffic onto its decentralized network, a transition beginning with BNB Smart Chain and Polygon and scheduled for completion by October 8, 2026, according to Blockchain. This protocol-wide shift is designed to increase active usage and utility of the GRT token by channeling traffic through decentralized infrastructure, which is likely to drive new demand and enhance the project's long-term economic model. The move underscores a commitment to further decentralization and could encourage greater participation from both developers and token holders, reinforcing current positive momentum.
Momentum divergence emerges as buyers control but overbought signals flash
Technically, GRT/USD is trading above the MA-20, MA-50, and MA-200 on the hourly chart. The nearest Ichimoku Kijun support is visible at $0.02717. Intraday momentum is reinforced by a strong buy signal from MACD, ongoing buyer control according to ADX, and a buy indication from RSI. Stoch RSI is registering an oversold condition, while CCI and Awesome Oscillator remain neutral. Bull/Bear Power highlights that buyers are currently in charge of intraday trading. Despite strong upward momentum, the coinciding oversold oscillator readings introduce a divergence, suggesting the rally is advanced and may be vulnerable to pullbacks.
Consolidation favored with breakout risk on volatility shifts
Over the short term, GRT is expected to consolidate within a typical volatility band between $0.0257445 and $0.0296755. The probability of continued upside is high at 75%, while a downside move is less likely at 25%. The baseline scenario envisions range-bound action within this corridor. An upside breakout is possible if resistance is cleared, while a decline below the current key support would open the door for a bearish scenario.
Earlier, analysts noted that The Graph was maintaining strong bullish momentum, supported by persistent buying and positive technical alignment. The current consolidation phase, coupled with ongoing protocol upgrades, now centers attention on the $0.02717 support level as a key area for gauging directional risk in the coming sessions.










-
 Afghanistan
-
 Albania
-
 Algeria
-
 Angola
-
 Argentina
-
 Armenia
-
 Australia
-
 Austria
-
 Azerbaijan
-
 Bahamas
-
 Bahrain
-
 Bangladesh
-
 Belarus
-
 Belgium
-
 Bolivia
-
 Botswana
-
 Brazil
-
 Brunei
-
 Bulgaria
-
 Cambodia
-
 Cameroon
-
 Canada
-
 Chile
-
 China
-
 Colombia
-
 Congo
-
 Costa Rica
-
 Cote d'Ivoire
-
 Croatia
-
 Cuba
-
 Cyprus
-
 Czechia
-
 DR Congo
-
 Denmark
-
 Dominican Republic
-
 Ecuador
-
 Egypt
-
 El Salvador
-
 Estonia
-
 Eswatini
-
 Ethiopia
-
 Finland
-
 France
-
 Georgia
-
 Germany
-
 Ghana
-
 Greece
-
 Haiti
-
 Hong Kong
-
 Hungary
-
 India
-
 Indonesia
-
 Iran, Islamic republic
-
 Iraq
-
 Ireland
-
 Israel
-
 Italy
-
 Jamaica
-
 Japan
-
 Jordan
-
 Kazakhstan
-
 Kenya
-
 Korea
-
 Kuwait
-
 Kyrgyzstan
-
 Laos
-
 Latvia
-
 Lebanon
-
 Lesotho
-
 Libya
-
 Lithuania
-
 Luxembourg
-
 Madagascar
-
 Malaysia
-
 Malta
-
 Mauritius
-
 Mexico
-
 Moldova
-
 Mongolia
-
 Montenegro
-
 Morocco
-
 Mozambique
-
 Myanmar
-
 Namibia
-
 Nepal
-
 Netherlands
-
 New Zealand
-
 Nigeria
-
 North Macedonia
-
 Norway
-
 Oman
-
 Pakistan
-
 Palestine
-
 Panama
-
 Papua New Guinea
-
 Paraguay
-
 Peru
-
 Philippines
-
 Poland
-
 Portugal
-
 Puerto Rico
-
 Qatar
-
 Reunion
-
 Romania
-
 Rwanda
-
 Saudi Arabia
-
 Serbia
-
 Singapore
-
 Slovakia
-
 Slovenia
-
 Somalia
-
 South Africa
-
 Spain
-
 Sri Lanka
-
 Sweden
-
 Switzerland
-
 Syria
-
 Taiwan
-
 Tajikistan
-
 Tanzania
-
 Thailand
-
 Trinidad and Tobago
-
 Tunisia
-
 Turkey
-
 UAE
-
 Uganda
-
 Ukraine
-
 United Kingdom
-
United States
-
 Uruguay
-
 Uzbekistan
-
 Venezuela
-
 Vietnam
-
 Yemen
-
 Zambia
-
 Zimbabwe
- Forex
- Crypto












