

The Graph gains more than 10% after bullish alignment above key moving averages

The Graph (GRT) surged 10.19% today as strong technical momentum and persistent buying pressure drove the move. Robust alignment above all major daily moving averages supports the bullish quality of the advance, although overbought indicators signal that upside may be stretched in the near term.
 0.02027
0.02314000
Highlights
- GRT/USD is trading above all key moving averages, confirming strong bullish momentum across short to long-term timeframes.
- Momentum and trend indicators show active buying with the price up 10.19% at $0.02833, but overbought conditions persist.
- For the next five trading days, GRT/USD is projected to range between $0.02439 and $0.0354 with 20 buy, 3 sell, and 2 neutral signals.
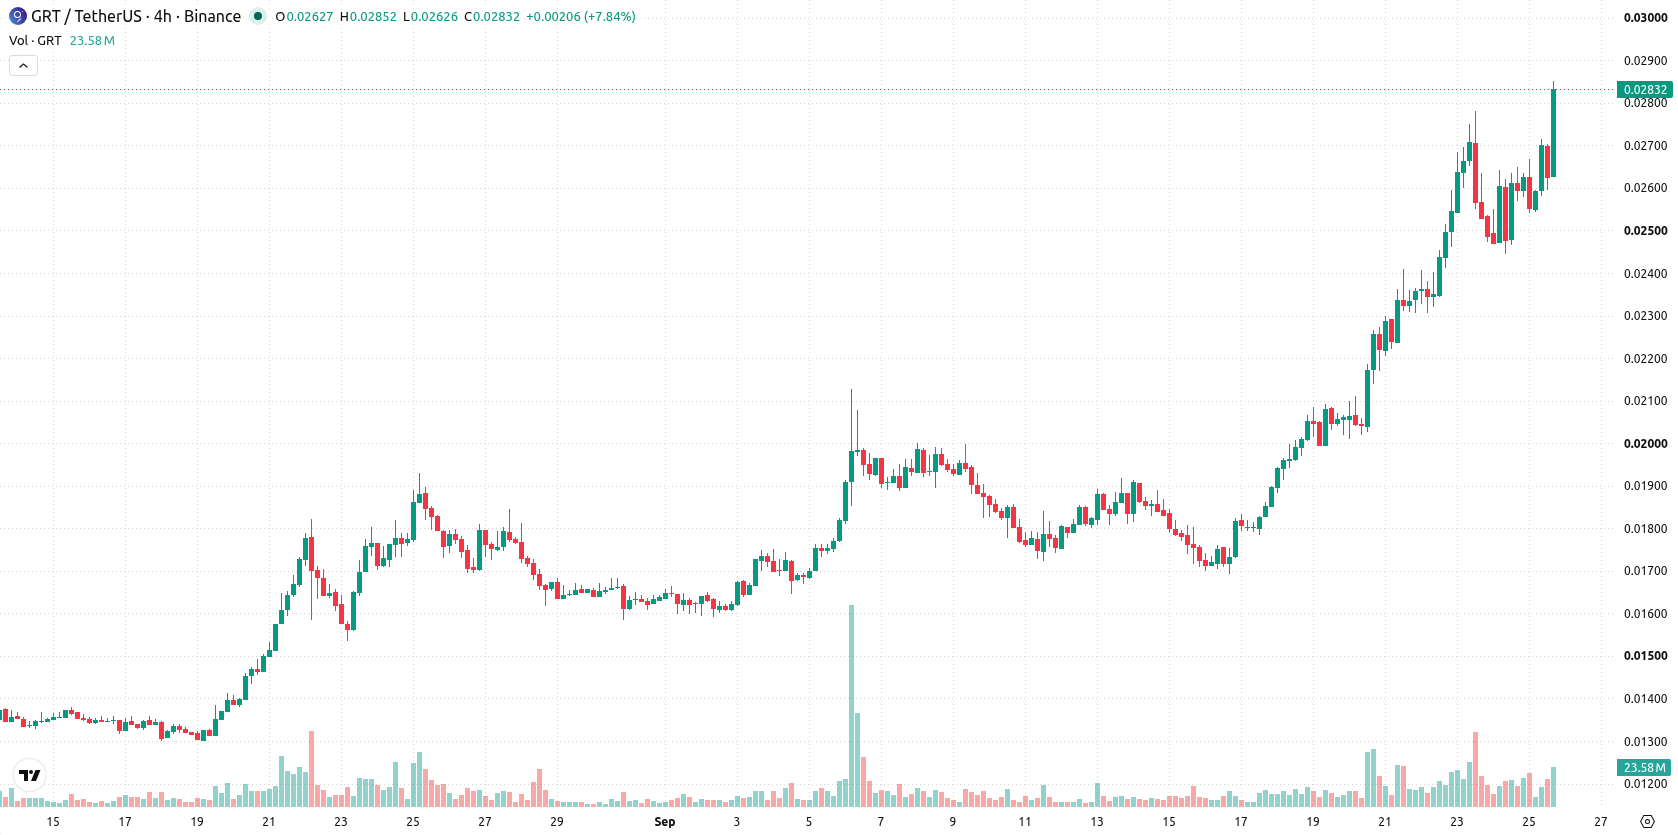
Bullish momentum consolidates as resistance and overbought signals align
GRT/USD is trading above its key daily moving averages: $0.020166 (MA-20), $0.0173302 (MA-50), and $0.02098195 (MA-200), confirming strong bullish momentum across short-, medium-, and long-term timeframes. Immediate resistance sits at $0.02852 and short-term support is at $0.02781, with the prevailing structure remaining bullish despite a longer-term bearish bias. Momentum indicators, including the MACD and ADX, reinforce active buying, while the RSI, Stochastic RSI, and CCI flag overbought conditions, highlighting a stretched market. The Bull/Bear Power remains positive and the Awesome Oscillator supports the upward trend, with intraday volatility notable at 12.24% and price action holding near the session highs.
Earlier, analysts noted that The Graph was demonstrating solid technical momentum and benefitting from utility expansion, with consolidation near key levels being a central theme. The latest analysis strengthens this outlook by highlighting persistent buying and sustained bullish structure, making the $0.02852 resistance zone a pivotal level for potential upside continuation in the coming days.











-
 Afghanistan
-
 Albania
-
 Algeria
-
 Angola
-
 Argentina
-
 Armenia
-
 Australia
-
 Austria
-
 Azerbaijan
-
 Bahamas
-
 Bahrain
-
 Bangladesh
-
 Belarus
-
 Belgium
-
 Bolivia
-
 Botswana
-
 Brazil
-
 Brunei
-
 Bulgaria
-
 Cambodia
-
 Cameroon
-
 Canada
-
 Chile
-
 China
-
 Colombia
-
 Congo
-
 Costa Rica
-
 Cote d'Ivoire
-
 Croatia
-
 Cuba
-
 Cyprus
-
 Czechia
-
 DR Congo
-
 Denmark
-
 Dominican Republic
-
 Ecuador
-
 Egypt
-
 El Salvador
-
 Estonia
-
 Eswatini
-
 Ethiopia
-
 Finland
-
 France
-
 Georgia
-
 Germany
-
 Ghana
-
 Greece
-
 Haiti
-
 Hong Kong
-
 Hungary
-
 India
-
 Indonesia
-
 Iran, Islamic republic
-
 Iraq
-
 Ireland
-
 Israel
-
 Italy
-
 Jamaica
-
 Japan
-
 Jordan
-
 Kazakhstan
-
 Kenya
-
 Korea
-
 Kuwait
-
 Kyrgyzstan
-
 Laos
-
 Latvia
-
 Lebanon
-
 Lesotho
-
 Libya
-
 Lithuania
-
 Luxembourg
-
 Madagascar
-
 Malaysia
-
 Malta
-
 Mauritius
-
 Mexico
-
 Moldova
-
 Mongolia
-
 Montenegro
-
 Morocco
-
 Mozambique
-
 Myanmar
-
 Namibia
-
 Nepal
-
 Netherlands
-
 New Zealand
-
 Nigeria
-
 North Macedonia
-
 Norway
-
 Oman
-
 Pakistan
-
 Palestine
-
 Panama
-
 Papua New Guinea
-
 Paraguay
-
 Peru
-
 Philippines
-
 Poland
-
 Portugal
-
 Puerto Rico
-
 Qatar
-
 Reunion
-
 Romania
-
 Rwanda
-
 Saudi Arabia
-
 Serbia
-
 Singapore
-
 Slovakia
-
 Slovenia
-
 Somalia
-
 South Africa
-
 Spain
-
 Sri Lanka
-
 Sweden
-
 Switzerland
-
 Syria
-
 Taiwan
-
 Tajikistan
-
 Tanzania
-
 Thailand
-
 Trinidad and Tobago
-
 Tunisia
-
 Turkey
-
 UAE
-
 Uganda
-
 Ukraine
-
 United Kingdom
-
United States
-
 Uruguay
-
 Uzbekistan
-
 Venezuela
-
 Vietnam
-
 Yemen
-
 Zambia
-
 Zimbabwe
- Forex
- Crypto












