

Maple technical analysis: Pullback gains traction with reduced buying pressure

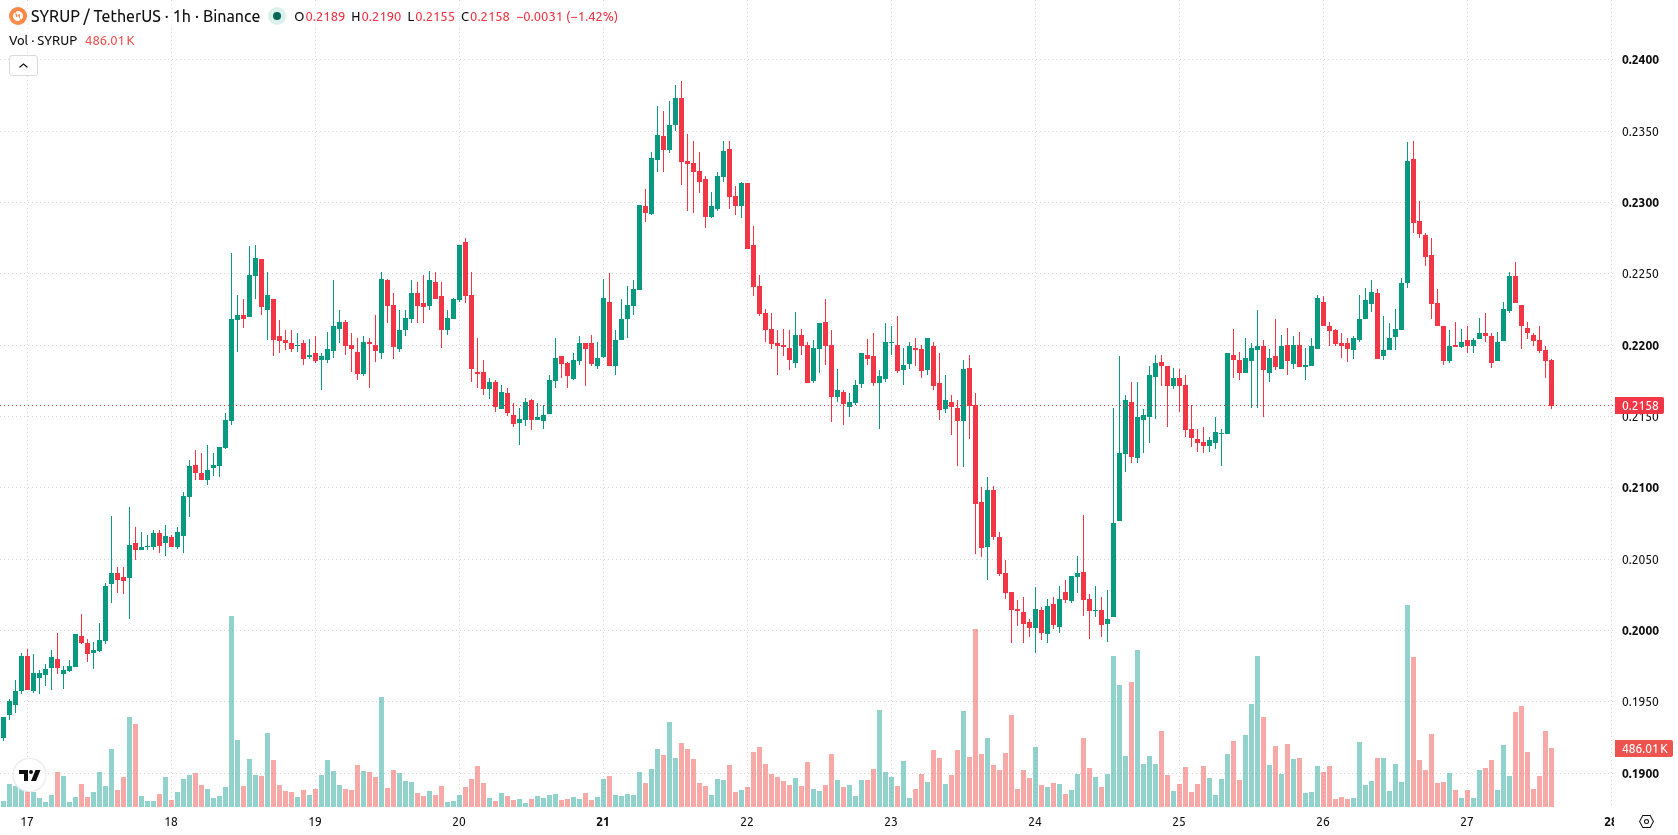
Maple (SYRUP) is trading at $0.2158, marking a 7.22% decline for the day. The asset is currently positioned below its key short- and medium-term moving averages, while remaining above the longer-term average.
 0.1088
0.1386
Highlights
- SYRUP/USD closed at $0.2158, down 7.22% on the day after opening with a negative gap during high volatility.
- Technical momentum and oscillator indicators are negative or oversold, indicating prevailing short-term selling pressure and market exhaustion.
- Price is expected to trade between $0.2068 and $0.2304 in coming sessions, with a 65% probability of further decline.
Technical weakness as resistance holds amid oversold signals
SYRUP/USD is currently trading below the MA-20 and MA-50, while holding above the MA-200. On the technical chart, the Ichimoku Kijun at $0.226 acts as immediate resistance. Momentum indicators present a negative bias, with MACD giving a Sell signal, while ADX shows a neutral trend. RSI also signals Sell, and both Stoch RSI and CCI are in oversold territory, suggesting short-term exhaustion. Bull/Bear Power favors sellers, and the Awesome Oscillator remains in alignment with the prevailing downward trend.
Sideways risk as volatility constrains near-term direction
In the near term, price is expected to range between $0.2068 and $0.2304, reflecting the current volatility band. There is a 35% probability assigned to an upward rebound, while the likelihood of further declines stands at 65%. The base scenario anticipates continued sideways movement within this range. A bullish outcome would require a break above $0.226, while a bearish outcome would be confirmed if price drops below $0.2068, increasing the risk of continued downside momentum.
Earlier, analysts noted that Maple was experiencing ongoing bearish momentum and persistent downside pressure according to key technical indicators. The latest analysis reaffirms this bias, highlighting that traders should closely monitor the $0.2068 support level for signs of increased downside risk or potential short-term stabilization.










-
 Afghanistan
-
 Albania
-
 Algeria
-
 Angola
-
 Argentina
-
 Armenia
-
 Australia
-
 Austria
-
 Azerbaijan
-
 Bahamas
-
 Bahrain
-
 Bangladesh
-
 Belarus
-
 Belgium
-
 Bolivia
-
 Botswana
-
 Brazil
-
 Brunei
-
 Bulgaria
-
 Cambodia
-
 Cameroon
-
 Canada
-
 Chile
-
 China
-
 Colombia
-
 Congo
-
 Costa Rica
-
 Cote d'Ivoire
-
 Croatia
-
 Cuba
-
 Cyprus
-
 Czechia
-
 DR Congo
-
 Denmark
-
 Dominican Republic
-
 Ecuador
-
 Egypt
-
 El Salvador
-
 Estonia
-
 Eswatini
-
 Ethiopia
-
 Finland
-
 France
-
 Georgia
-
 Germany
-
 Ghana
-
 Greece
-
 Haiti
-
 Hong Kong
-
 Hungary
-
 India
-
 Indonesia
-
 Iran, Islamic republic
-
 Iraq
-
 Ireland
-
 Israel
-
 Italy
-
 Jamaica
-
 Japan
-
 Jordan
-
 Kazakhstan
-
 Kenya
-
 Korea
-
 Kuwait
-
 Kyrgyzstan
-
 Laos
-
 Latvia
-
 Lebanon
-
 Lesotho
-
 Libya
-
 Lithuania
-
 Luxembourg
-
 Madagascar
-
 Malaysia
-
 Malta
-
 Mauritius
-
 Mexico
-
 Moldova
-
 Mongolia
-
 Montenegro
-
 Morocco
-
 Mozambique
-
 Myanmar
-
 Namibia
-
 Nepal
-
 Netherlands
-
 New Zealand
-
 Nigeria
-
 North Macedonia
-
 Norway
-
 Oman
-
 Pakistan
-
 Palestine
-
 Panama
-
 Papua New Guinea
-
 Paraguay
-
 Peru
-
 Philippines
-
 Poland
-
 Portugal
-
 Puerto Rico
-
 Qatar
-
 Reunion
-
 Romania
-
 Rwanda
-
 Saudi Arabia
-
 Serbia
-
 Singapore
-
 Slovakia
-
 Slovenia
-
 Somalia
-
 South Africa
-
 Spain
-
 Sri Lanka
-
 Sweden
-
 Switzerland
-
 Syria
-
 Taiwan
-
 Tajikistan
-
 Tanzania
-
 Thailand
-
 Trinidad and Tobago
-
 Tunisia
-
 Turkey
-
 UAE
-
 Uganda
-
 Ukraine
-
 United Kingdom
-
United States
-
 Uruguay
-
 Uzbekistan
-
 Venezuela
-
 Vietnam
-
 Yemen
-
 Zambia
-
 Zimbabwe
- Forex
- Crypto












