

Why is Sei up today? Key levels to watch as buyers drive momentum

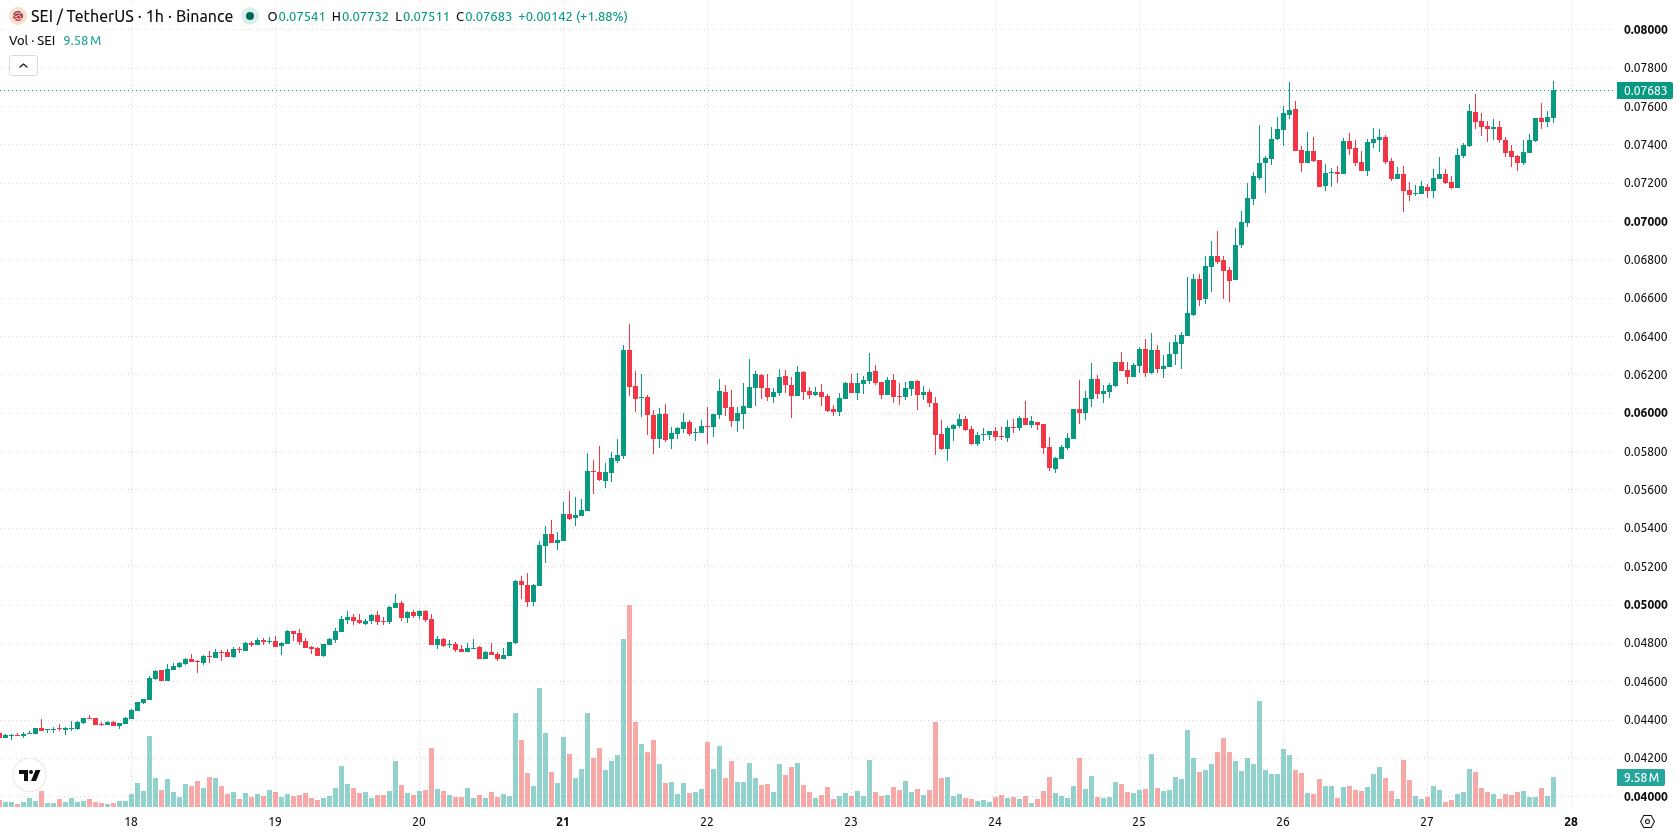
Sei (SEI) is trading at $0.0765, reflecting a daily increase of 7.13%. The asset remains positioned above its key moving averages, signaling strength relative to recent trend levels.
 0.0484
0.0545
Highlights
- SEI/USD is trading well above key moving averages on both hourly and daily timeframes, confirming strong bullish momentum.
- Momentum indicators such as MACD, ADX, and Bull/Bear Power support a buy signal, but overbought conditions raise slight risk of a pullback.
- Price is at $0.0765, up 7.13% today; projected 2 to 3 day range is $0.0712 to $0.0853 with over 80% likelihood of upward continuation.
Sustained momentum amid overbought signals and intraday advances
On the hourly chart, SEI/USD is trading above both the MA-20 at $0.074 and MA-50 at $0.0735, while the daily MA-200 is well below at $0.0534. The Ichimoku Kijun on the daily timeframe is set at $0.0736 and acts as immediate support. Momentum remains strong with both MACD and ADX flashing buy signals, and the RSI at 63.752 suggests ongoing buying interest. The CCI indicates overbought conditions while Stochastic RSI is neutral, and Bull/Bear Power displays buyer dominance. The Awesome Oscillator (AO) supports the observed upside momentum. Price currently trades near the intraday high with a positive gap of $0.0004, alongside high volatility and no major divergences observed between oscillators and momentum readings.
Upside scenario favored barring breakdown below immediate support
For the next 2–3 trading days, SEI/USD is projected to trade within a range of $0.0712 to $0.0853 based on typical volatility patterns. The probability of the price moving higher remains very strong, estimated above 80%. The base case expects consolidation inside the present range. Should resistance be broken, a move toward higher levels becomes likely, while a break below the immediate support at the Ichimoku Kijun may invite short-term weakness.
Earlier, analysts noted that Sei was exhibiting resilient bullish momentum amid consolidation, with traders advised to monitor for a breakout above resistance to validate further gains. The latest technical mix confirms this upward bias and, with strong momentum reinforced by multiple indicators, underscores the importance of the Ichimoku Kijun support at $0.0736 as a pivotal level for short-term direction.










-
 Afghanistan
-
 Albania
-
 Algeria
-
 Angola
-
 Argentina
-
 Armenia
-
 Australia
-
 Austria
-
 Azerbaijan
-
 Bahamas
-
 Bahrain
-
 Bangladesh
-
 Belarus
-
 Belgium
-
 Bolivia
-
 Botswana
-
 Brazil
-
 Brunei
-
 Bulgaria
-
 Cambodia
-
 Cameroon
-
 Canada
-
 Chile
-
 China
-
 Colombia
-
 Congo
-
 Costa Rica
-
 Cote d'Ivoire
-
 Croatia
-
 Cuba
-
 Cyprus
-
 Czechia
-
 DR Congo
-
 Denmark
-
 Dominican Republic
-
 Ecuador
-
 Egypt
-
 El Salvador
-
 Estonia
-
 Eswatini
-
 Ethiopia
-
 Finland
-
 France
-
 Georgia
-
 Germany
-
 Ghana
-
 Greece
-
 Haiti
-
 Hong Kong
-
 Hungary
-
 India
-
 Indonesia
-
 Iran, Islamic republic
-
 Iraq
-
 Ireland
-
 Israel
-
 Italy
-
 Jamaica
-
 Japan
-
 Jordan
-
 Kazakhstan
-
 Kenya
-
 Korea
-
 Kuwait
-
 Kyrgyzstan
-
 Laos
-
 Latvia
-
 Lebanon
-
 Lesotho
-
 Libya
-
 Lithuania
-
 Luxembourg
-
 Madagascar
-
 Malaysia
-
 Malta
-
 Mauritius
-
 Mexico
-
 Moldova
-
 Mongolia
-
 Montenegro
-
 Morocco
-
 Mozambique
-
 Myanmar
-
 Namibia
-
 Nepal
-
 Netherlands
-
 New Zealand
-
 Nigeria
-
 North Macedonia
-
 Norway
-
 Oman
-
 Pakistan
-
 Palestine
-
 Panama
-
 Papua New Guinea
-
 Paraguay
-
 Peru
-
 Philippines
-
 Poland
-
 Portugal
-
 Puerto Rico
-
 Qatar
-
 Reunion
-
 Romania
-
 Rwanda
-
 Saudi Arabia
-
 Serbia
-
 Singapore
-
 Slovakia
-
 Slovenia
-
 Somalia
-
 South Africa
-
 Spain
-
 Sri Lanka
-
 Sweden
-
 Switzerland
-
 Syria
-
 Taiwan
-
 Tajikistan
-
 Tanzania
-
 Thailand
-
 Trinidad and Tobago
-
 Tunisia
-
 Turkey
-
 UAE
-
 Uganda
-
 Ukraine
-
 United Kingdom
-
United States
-
 Uruguay
-
 Uzbekistan
-
 Venezuela
-
 Vietnam
-
 Yemen
-
 Zambia
-
 Zimbabwe
- Forex
- Crypto












