

Can Sei sustain rebound as buyers remain in control?

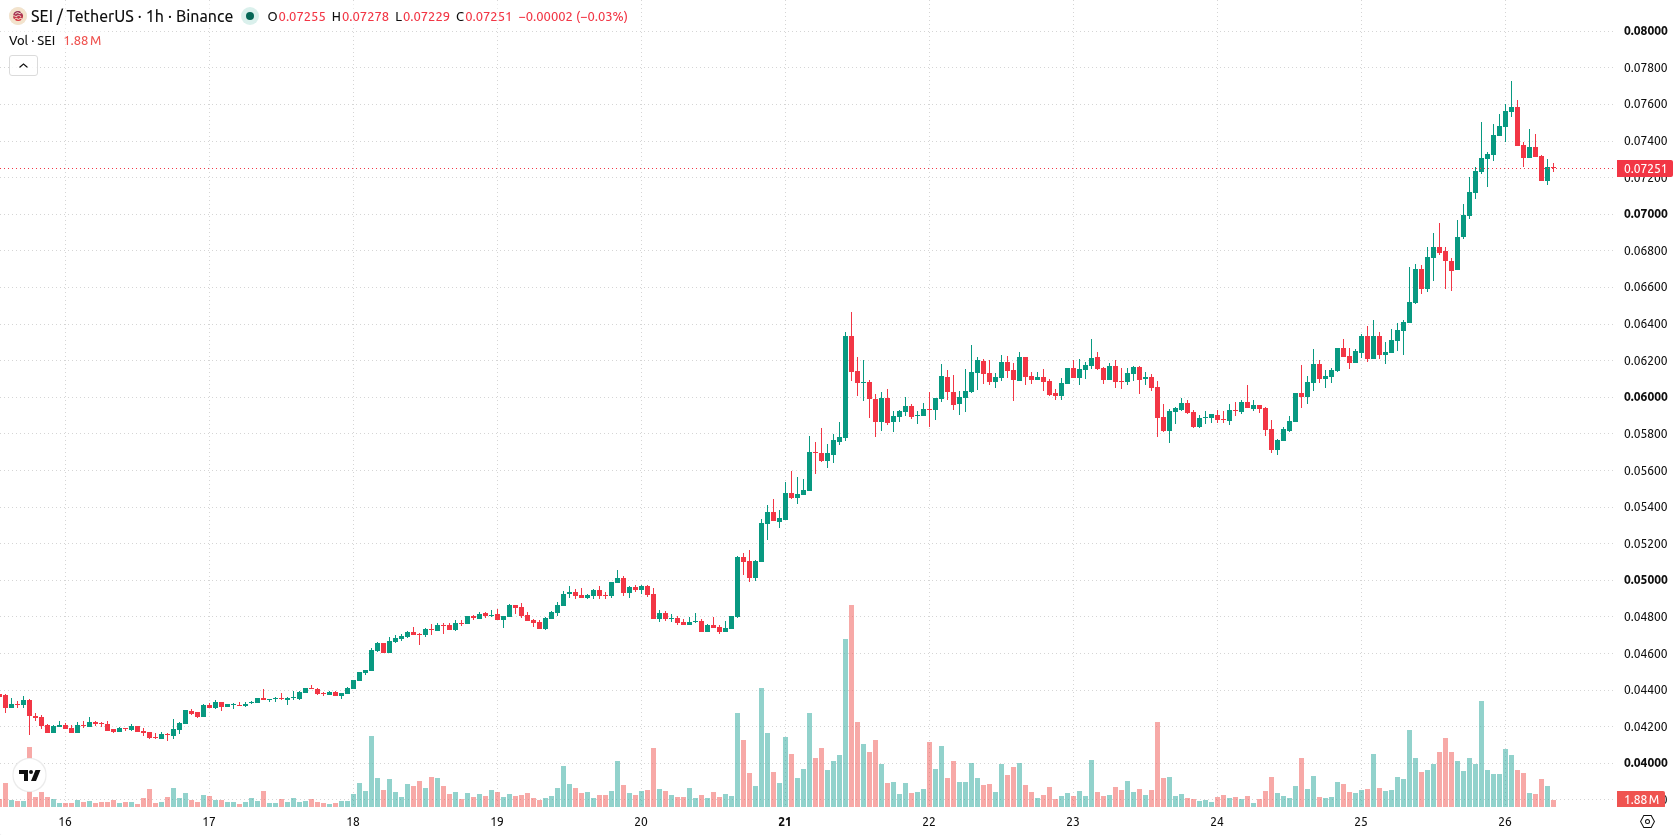
Sei (SEI) is trading at $0.0727 after rising 10.97% on the day, currently positioned above its key moving averages.
 0.0483
0.0545
Highlights
- SEI/USD is in a strong bullish trend across short, medium, and long timeframes with price positioned above key moving averages.
- Momentum indicators such as MACD and ADX support further upside, but oversold signals from Stoch RSI may precede a brief pullback.
- SEI/USD surged 10.97% to $0.0727 today and is expected to fluctuate between $0.0664 and $0.079 in the next few days.
Mixed oscillator signals as SEI nears volatility-supported lows
On the technical side, SEI/USD sits above the MA-20 and MA-50 on the hourly chart, and clear of the MA-200 on the daily timeframe. The Ichimoku Kijun provides immediate support at $0.0698. MACD signals a strong buy while ADX points to sustained bullish momentum; RSI prints 60 and is in buying territory, whereas Stoch RSI is oversold, raising the possibility of a brief pause or shallow pullback. CCI remains neutral, Bull/Bear Power shows strong buyer dominance, and the Awesome Oscillator is neutral, together illustrating some divergence among oscillators as price consolidates near the intraday low on elevated volatility.
High upside probability as volatility band limits pullback risk
Over the next several sessions, SEI/USD is most likely to trade within a volatility band of $0.0664 to $0.079. The probability of continued upside remains very high, while the odds of a significant pullback are low. Should price stabilize, the pair will likely fluctuate within this range; a clean break above resistance could drive quicker gains, whereas a drop below $0.0698 support might trigger additional short-term weakness.
Previously it was reported that institutional developments and ecosystem integrations had driven notable bullish momentum for Sei. The present consolidation near intraday lows, despite ongoing bullish technical signals, suggests traders should monitor for a decisive breakout above resistance to confirm continued upside.










-
 Afghanistan
-
 Albania
-
 Algeria
-
 Angola
-
 Argentina
-
 Armenia
-
 Australia
-
 Austria
-
 Azerbaijan
-
 Bahamas
-
 Bahrain
-
 Bangladesh
-
 Belarus
-
 Belgium
-
 Bolivia
-
 Botswana
-
 Brazil
-
 Brunei
-
 Bulgaria
-
 Cambodia
-
 Cameroon
-
 Canada
-
 Chile
-
 China
-
 Colombia
-
 Congo
-
 Costa Rica
-
 Cote d'Ivoire
-
 Croatia
-
 Cuba
-
 Cyprus
-
 Czechia
-
 DR Congo
-
 Denmark
-
 Dominican Republic
-
 Ecuador
-
 Egypt
-
 El Salvador
-
 Estonia
-
 Eswatini
-
 Ethiopia
-
 Finland
-
 France
-
 Georgia
-
 Germany
-
 Ghana
-
 Greece
-
 Haiti
-
 Hong Kong
-
 Hungary
-
 India
-
 Indonesia
-
 Iran, Islamic republic
-
 Iraq
-
 Ireland
-
 Israel
-
 Italy
-
 Jamaica
-
 Japan
-
 Jordan
-
 Kazakhstan
-
 Kenya
-
 Korea
-
 Kuwait
-
 Kyrgyzstan
-
 Laos
-
 Latvia
-
 Lebanon
-
 Lesotho
-
 Libya
-
 Lithuania
-
 Luxembourg
-
 Madagascar
-
 Malaysia
-
 Malta
-
 Mauritius
-
 Mexico
-
 Moldova
-
 Mongolia
-
 Montenegro
-
 Morocco
-
 Mozambique
-
 Myanmar
-
 Namibia
-
 Nepal
-
 Netherlands
-
 New Zealand
-
 Nigeria
-
 North Macedonia
-
 Norway
-
 Oman
-
 Pakistan
-
 Palestine
-
 Panama
-
 Papua New Guinea
-
 Paraguay
-
 Peru
-
 Philippines
-
 Poland
-
 Portugal
-
 Puerto Rico
-
 Qatar
-
 Reunion
-
 Romania
-
 Rwanda
-
 Saudi Arabia
-
 Serbia
-
 Singapore
-
 Slovakia
-
 Slovenia
-
 Somalia
-
 South Africa
-
 Spain
-
 Sri Lanka
-
 Sweden
-
 Switzerland
-
 Syria
-
 Taiwan
-
 Tajikistan
-
 Tanzania
-
 Thailand
-
 Trinidad and Tobago
-
 Tunisia
-
 Turkey
-
 UAE
-
 Uganda
-
 Ukraine
-
 United Kingdom
-
United States
-
 Uruguay
-
 Uzbekistan
-
 Venezuela
-
 Vietnam
-
 Yemen
-
 Zambia
-
 Zimbabwe
- Forex
- Crypto












