

Arbitrum support test: Can ARB avoid deeper losses?

Arbitrum (ARB) is trading at $0.2123 after a daily decline of 7.49%. The asset remains below its key short- and medium-term moving averages, while holding above longer-term support benchmarks.
 0.1338
0.1690
Highlights
- Arbitrum became the first blockchain to exceed 7,000 tokenized real-world assets, supporting expansion of on-chain asset infrastructure.
- Tokenized real-world assets on Arbitrum surpassed $1 billion in value, with USDai AI compute credit markets reaching $600 million in total value locked.
- ARB/USD trades below key moving averages with strong intraday selling pressure and is expected to move in the $0.2022 to $0.2224 range over the next few days.
Tokenized asset expansion contrasts with persistent selling pressure
Arbitrum became the first blockchain network to reach a milestone of 7,000 tokenized real-world assets, according to Coin Turk, underscoring a notable expansion in on-chain asset infrastructure that may influence overall platform activity. The network’s tokenized asset value also surpassed $1 billion, marking a significant step in scaling real-world applications and potentially supporting institutional engagement. Additionally, USDai’s tokenized AI compute credit markets on Arbitrum attained $600 million in total value locked, reflecting ongoing growth in specialized DeFi solutions. These positive developments come as price action has remained under broader selling pressure.
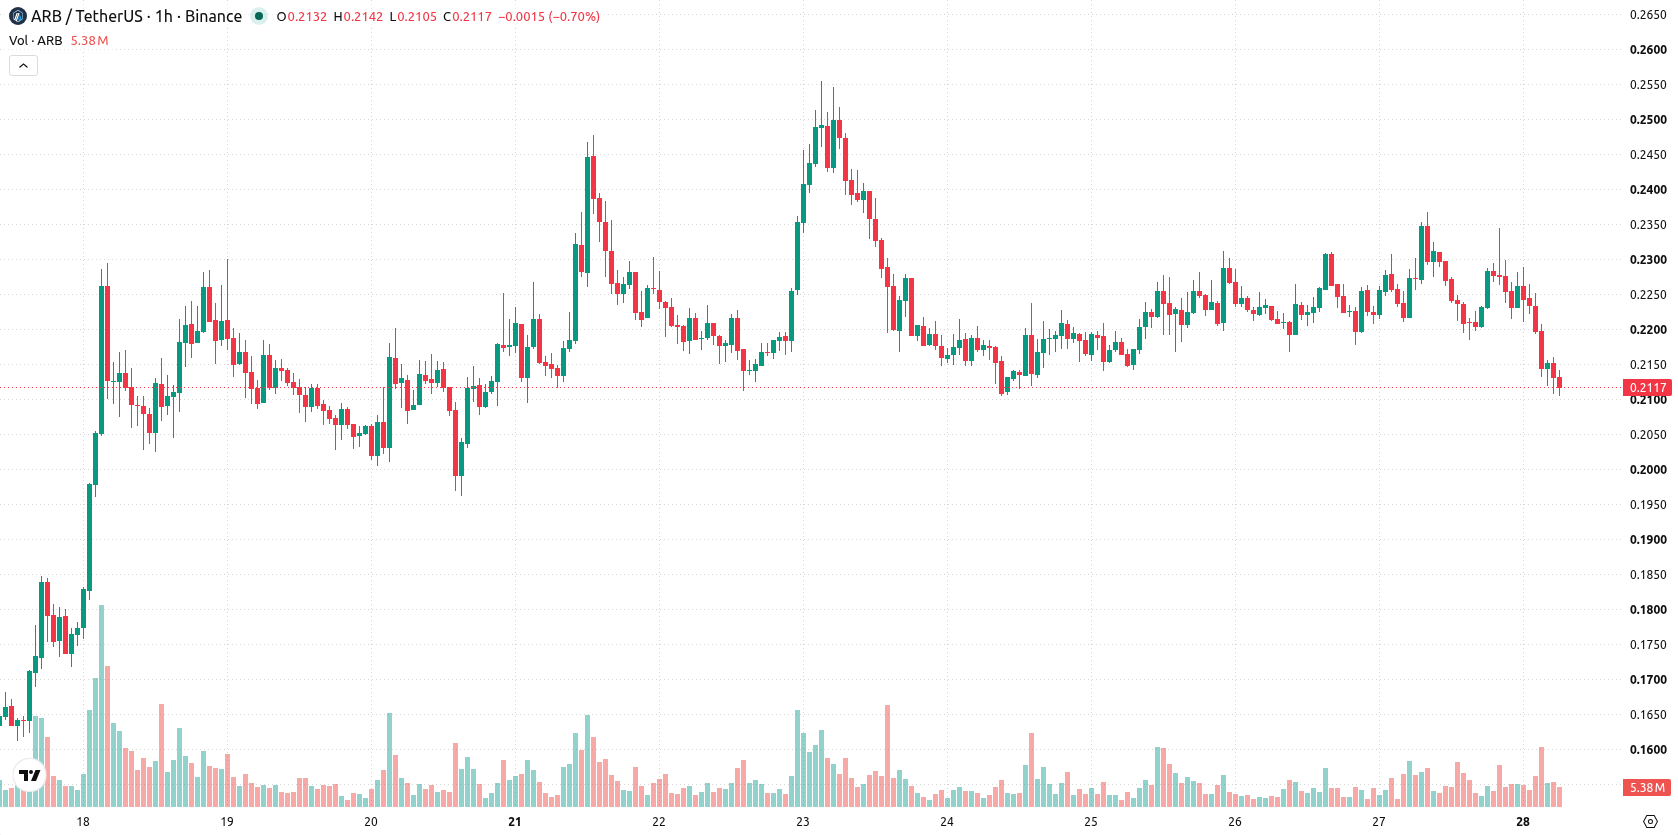
Sustained bearish momentum amid oversold signals and volatility spike
On the hourly chart, ARB/USD is trading below the MA-20 and MA-50, signaling persistent short- and medium-term selling pressure, while the MA-200 below provides structural support. The Ichimoku Kijun at $0.2243 serves as immediate resistance, and price action has created a negative gap with increased volatility. Momentum indicators show continued weakness, with MACD in a sell configuration, neutral ADX, and negative readings from Bull/Bear Power and Awesome Oscillator confirming dominance by sellers. Meanwhile, deeply oversold readings from RSI, Stoch RSI, and CCI highlight the potential for technical exhaustion on the downside.
Range-bound bias persists as downward risk remains elevated
Over the next two to three trading days, ARB/USD is expected to remain within a range of $0.2022 to $0.2224, reflecting typical volatility for the current environment. The likelihood of an upward move is assessed as very low, with further downside viewed as the high-probability scenario absent a reversal signal. The baseline expectation sees the pair staying range-bound between support and resistance levels, while a sustained breach below $0.2022 would indicate renewed selling, and a bullish scenario would require a move above the immediate resistance at $0.2243.
Earlier, analysts noted that Arbitrum was shifting toward a strengthening trend, supported by institutional participation and ongoing ecosystem growth. The current technical setup, however, highlights prevailing downside risk, with close attention now warranted on whether support near $0.2022 can hold in the days ahead.










-
 Afghanistan
-
 Albania
-
 Algeria
-
 Angola
-
 Argentina
-
 Armenia
-
 Australia
-
 Austria
-
 Azerbaijan
-
 Bahamas
-
 Bahrain
-
 Bangladesh
-
 Belarus
-
 Belgium
-
 Bolivia
-
 Botswana
-
 Brazil
-
 Brunei
-
 Bulgaria
-
 Cambodia
-
 Cameroon
-
 Canada
-
 Chile
-
 China
-
 Colombia
-
 Congo
-
 Costa Rica
-
 Cote d'Ivoire
-
 Croatia
-
 Cuba
-
 Cyprus
-
 Czechia
-
 DR Congo
-
 Denmark
-
 Dominican Republic
-
 Ecuador
-
 Egypt
-
 El Salvador
-
 Estonia
-
 Eswatini
-
 Ethiopia
-
 Finland
-
 France
-
 Georgia
-
 Germany
-
 Ghana
-
 Greece
-
 Haiti
-
 Hong Kong
-
 Hungary
-
 India
-
 Indonesia
-
 Iran, Islamic republic
-
 Iraq
-
 Ireland
-
 Israel
-
 Italy
-
 Jamaica
-
 Japan
-
 Jordan
-
 Kazakhstan
-
 Kenya
-
 Korea
-
 Kuwait
-
 Kyrgyzstan
-
 Laos
-
 Latvia
-
 Lebanon
-
 Lesotho
-
 Libya
-
 Lithuania
-
 Luxembourg
-
 Madagascar
-
 Malaysia
-
 Malta
-
 Mauritius
-
 Mexico
-
 Moldova
-
 Mongolia
-
 Montenegro
-
 Morocco
-
 Mozambique
-
 Myanmar
-
 Namibia
-
 Nepal
-
 Netherlands
-
 New Zealand
-
 Nigeria
-
 North Macedonia
-
 Norway
-
 Oman
-
 Pakistan
-
 Palestine
-
 Panama
-
 Papua New Guinea
-
 Paraguay
-
 Peru
-
 Philippines
-
 Poland
-
 Portugal
-
 Puerto Rico
-
 Qatar
-
 Reunion
-
 Romania
-
 Rwanda
-
 Saudi Arabia
-
 Serbia
-
 Singapore
-
 Slovakia
-
 Slovenia
-
 Somalia
-
 South Africa
-
 Spain
-
 Sri Lanka
-
 Sweden
-
 Switzerland
-
 Syria
-
 Taiwan
-
 Tajikistan
-
 Tanzania
-
 Thailand
-
 Trinidad and Tobago
-
 Tunisia
-
 Turkey
-
 UAE
-
 Uganda
-
 Ukraine
-
 United Kingdom
-
United States
-
 Uruguay
-
 Uzbekistan
-
 Venezuela
-
 Vietnam
-
 Yemen
-
 Zambia
-
 Zimbabwe
- Forex
- Crypto












