

Pendle technical analysis: $2.16 support in focus as selloff accelerates

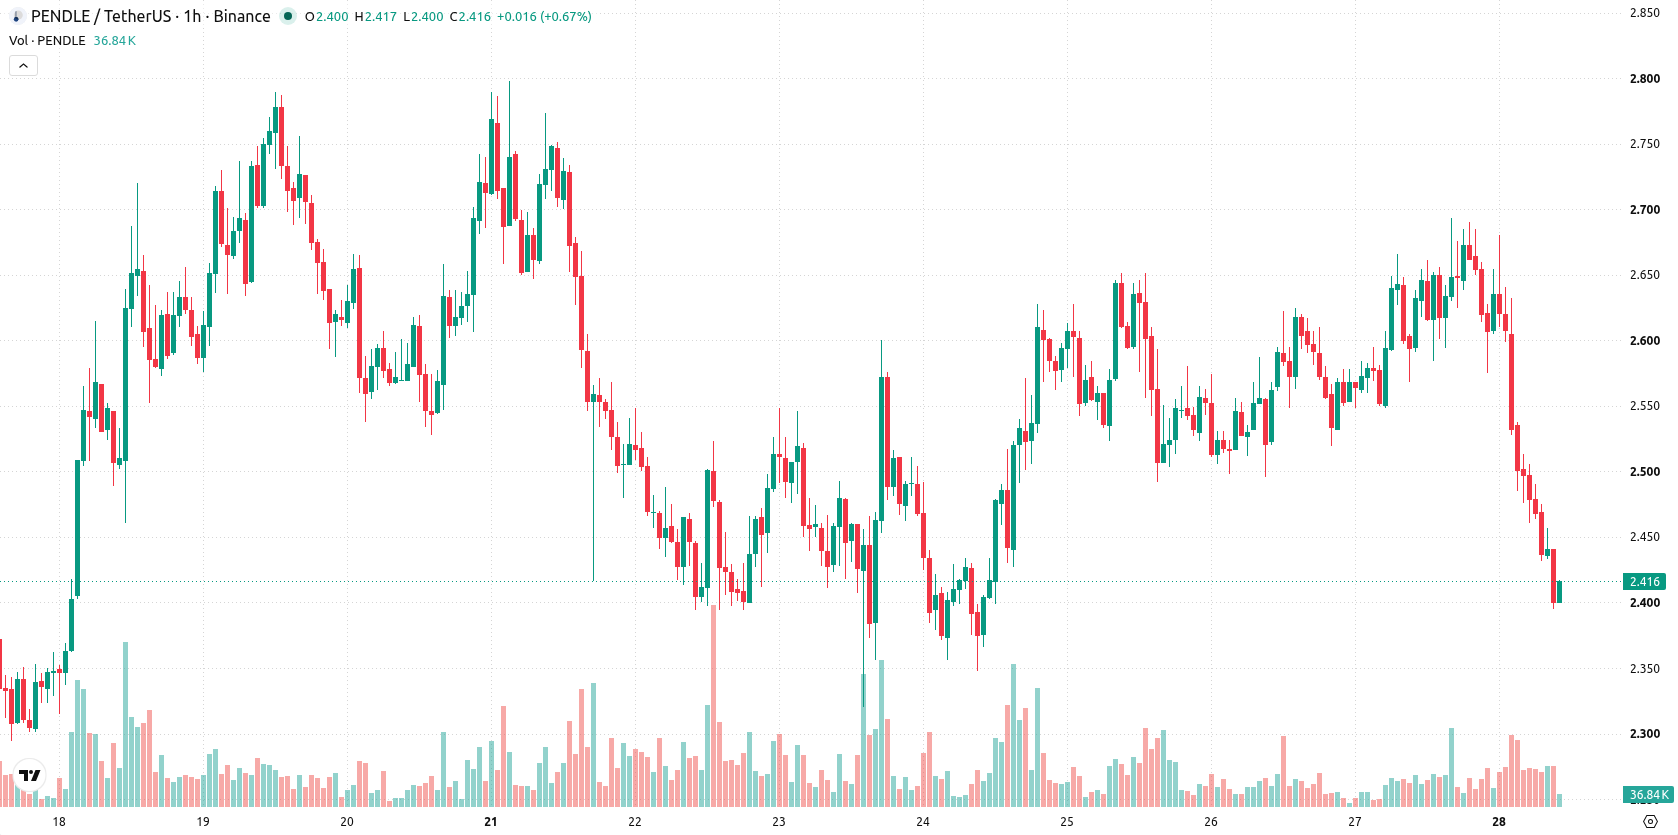
Pendle (PENDLE) is trading at $2.41, down 7.21% on the day. The price currently sits below its key short- and medium-term moving averages and remains near the session low amid broad volatility.
 1.541
1.6410
Highlights
- Pendle USDC vault assets climbed above $75 million, ranking among the eight largest vaults on Ethereum by total value locked.
- Significant capital flows into Pendle vaults increase protocol liquidity, which may draw additional institutional interest.
- PENDLE/USD trades under key short-term moving averages with oversold signals, and is expected to remain in a $2.163 to $2.4914 range with downside risk dominating.
Record vault inflows offset by persistent DeFi selling pressure
Pendle’s USDC vault recently surpassed $75 million in total value locked, establishing it as one of the eight largest vaults on Ethereum, according to Coinfomania. This substantial inflow of capital highlights increased engagement from DeFi participants and fosters deeper protocol liquidity, which can attract further institutional interest. However, this positive development has so far been accompanied by persistent market selling pressure.
Bearish signals build as sellers dominate and support holds
On the H1 chart, PENDLE is trading below the MA-20 at $2.57 and below the MA-50 at $2.58, while the Ichimoku Kijun on the D1 timeframe at $2.55 marks an immediate resistance level. The daily MA-200 rests much lower at $1.55 and offers a significant support zone. Weak momentum is confirmed by a Sell signal on MACD, Neutral ADX, and oversold readings on RSI, Stoch RSI, and CCI. Bearish intraday bias is reinforced by dominance of sellers on Bull/Bear Power and by the Awesome Oscillator pointing to sustained downside momentum. No major divergences are observed, as indicators and price action remain aligned.
Downside risks persist as support threatened by low breakout odds
Over the coming 2–3 trading days, the price of PENDLE is expected to stabilize inside a band between $2.16 and $2.49 under typical volatility. The likelihood of an upside breakout above $2.55 is low, with a much higher risk of further declines if support at $2.16 is breached. A move above $2.55 would be required to flip near-term bias, while sustained trading below current levels increases the probability of retesting the lower support region.
Earlier, analysts noted that Pendle maintained a strong bullish structure despite technical headwinds and persistent selling pressure. The latest price action and weakening momentum indicators signal a shift toward increased downside risk, with traders now watching the $2.16 support for signs of further deterioration or stabilization in the coming sessions.










-
 Afghanistan
-
 Albania
-
 Algeria
-
 Angola
-
 Argentina
-
 Armenia
-
 Australia
-
 Austria
-
 Azerbaijan
-
 Bahamas
-
 Bahrain
-
 Bangladesh
-
 Belarus
-
 Belgium
-
 Bolivia
-
 Botswana
-
 Brazil
-
 Brunei
-
 Bulgaria
-
 Cambodia
-
 Cameroon
-
 Canada
-
 Chile
-
 China
-
 Colombia
-
 Congo
-
 Costa Rica
-
 Cote d'Ivoire
-
 Croatia
-
 Cuba
-
 Cyprus
-
 Czechia
-
 DR Congo
-
 Denmark
-
 Dominican Republic
-
 Ecuador
-
 Egypt
-
 El Salvador
-
 Estonia
-
 Eswatini
-
 Ethiopia
-
 Finland
-
 France
-
 Georgia
-
 Germany
-
 Ghana
-
 Greece
-
 Haiti
-
 Hong Kong
-
 Hungary
-
 India
-
 Indonesia
-
 Iran, Islamic republic
-
 Iraq
-
 Ireland
-
 Israel
-
 Italy
-
 Jamaica
-
 Japan
-
 Jordan
-
 Kazakhstan
-
 Kenya
-
 Korea
-
 Kuwait
-
 Kyrgyzstan
-
 Laos
-
 Latvia
-
 Lebanon
-
 Lesotho
-
 Libya
-
 Lithuania
-
 Luxembourg
-
 Madagascar
-
 Malaysia
-
 Malta
-
 Mauritius
-
 Mexico
-
 Moldova
-
 Mongolia
-
 Montenegro
-
 Morocco
-
 Mozambique
-
 Myanmar
-
 Namibia
-
 Nepal
-
 Netherlands
-
 New Zealand
-
 Nigeria
-
 North Macedonia
-
 Norway
-
 Oman
-
 Pakistan
-
 Palestine
-
 Panama
-
 Papua New Guinea
-
 Paraguay
-
 Peru
-
 Philippines
-
 Poland
-
 Portugal
-
 Puerto Rico
-
 Qatar
-
 Reunion
-
 Romania
-
 Rwanda
-
 Saudi Arabia
-
 Serbia
-
 Singapore
-
 Slovakia
-
 Slovenia
-
 Somalia
-
 South Africa
-
 Spain
-
 Sri Lanka
-
 Sweden
-
 Switzerland
-
 Syria
-
 Taiwan
-
 Tajikistan
-
 Tanzania
-
 Thailand
-
 Trinidad and Tobago
-
 Tunisia
-
 Turkey
-
 UAE
-
 Uganda
-
 Ukraine
-
 United Kingdom
-
United States
-
 Uruguay
-
 Uzbekistan
-
 Venezuela
-
 Vietnam
-
 Yemen
-
 Zambia
-
 Zimbabwe
- Forex
- Crypto












