

Avalanche range holds above $10.15 as RSI approaches overbought territory: weekly outlook

Institutional momentum has kept Avalanche (AVAX) around $11, with prices climbing nearly 7% this week. A wave of fresh activity from major financial names has reinforced the recovery, but stretched conditions raise questions about how far this run can last. Traders are watching for the next leg as institutional flows and technical signals both shape the week ahead.
 8.69
9.16
Highlights
- Avalanche is trading at $11.16, up 7.25% over the past 7 days with a sustained move above major trend levels.
- The asset remains in a firm uptrend with bullish technical readings and 18.33% weekly volatility supporting further gains.
- Forecast range for the next 7 days is $10.17 to $12.14, with support at $10.15 and resistance at $12.01.
Rising institutional activity boosts sentiment as Goldman Sachs and upgrades fuel flows
Avalanche saw heightened institutional engagement after Goldman Sachs made its $100 billion Financial Square Treasury Instruments Fund accessible to institutions via Lynq, a network built on Avalanche, according to Seeking Alpha and Yahoo Finance. At the same time, Investing.com highlighted the Avalanche Treasury’s $15 million AVAX token sale to the Avalanche Foundation, aiming to shorten lock-up periods. Ongoing tests by Intercontinental Exchange and the implementation of the Helicon upgrade on September 22, 2026, to improve network speed and scalability, add to the sense of rising institutional focus in the coming week.
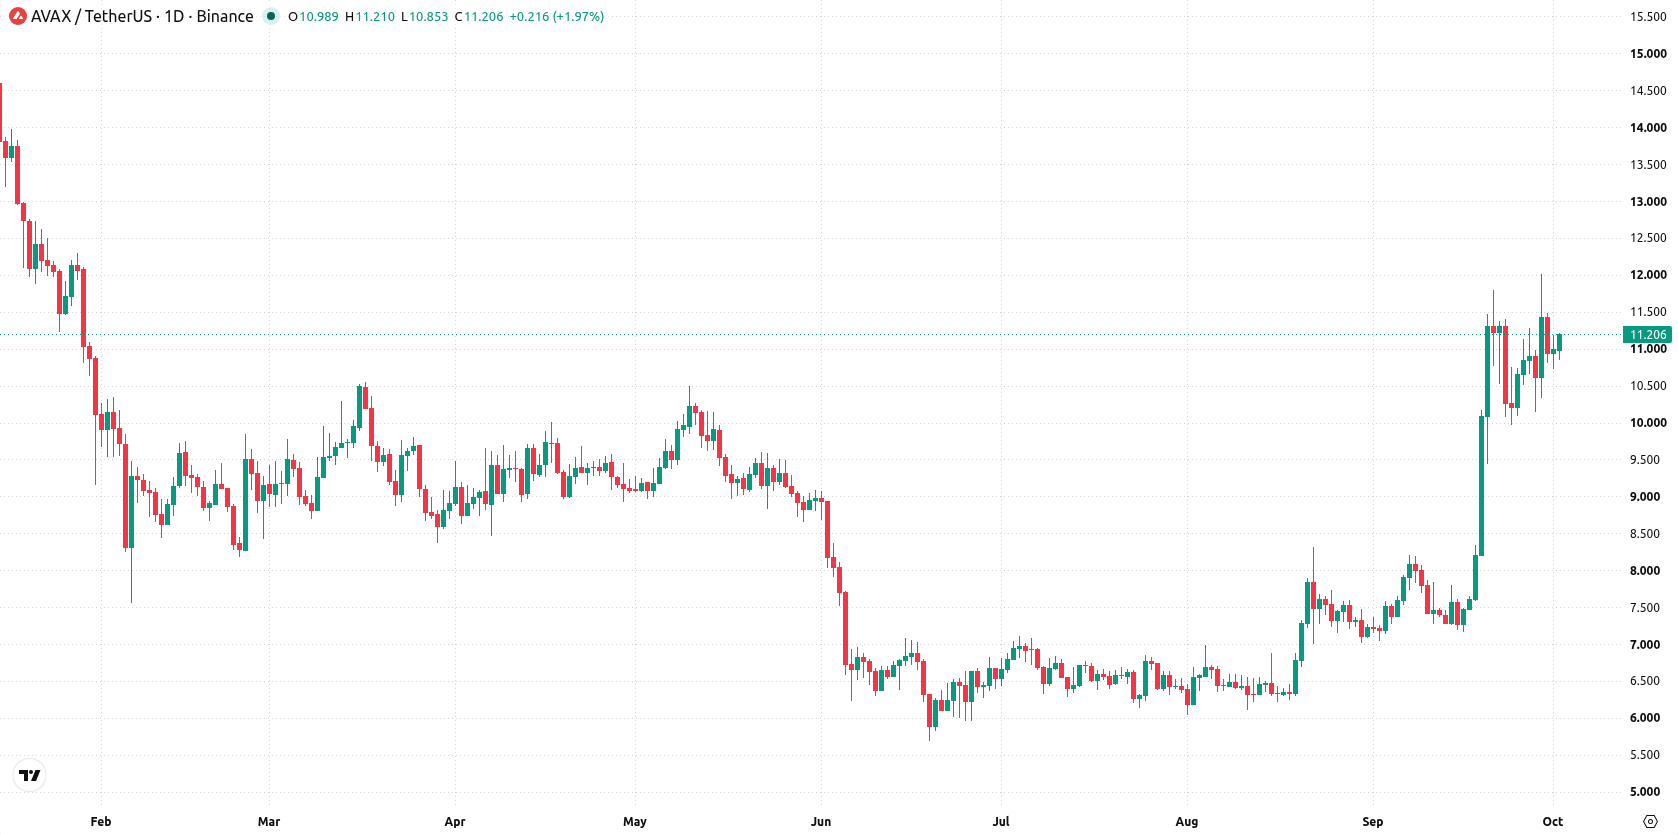
Bullish momentum persists over the week as MACD and ADX reinforce uptrend
On the daily chart, Avalanche maintains a firm uptrend, supported by strong momentum readings and 18.33% weekly volatility. The MACD and ADX both reinforce the bullish outlook, while RSI at 65.53 is approaching overbought territory, signaling robust buying pressure but also some caution. The nearest support is seen at $10.15, with resistance at $12.01, and the Ichimoku Kijun at $9.59 provides a secondary support level. This structure points to a sustained move higher with a firm trend likely over the near term.
Upside bias holds for next week unless $12.01 resistance breaks
For the next 7 days, the expected range stands between $10.17 and $12.14. There is a very high probability (more than 80%) of further price gains and a very low probability of a decline. The base case is continued trending above $10.15 and below $12.01. A push above resistance at $12.01 would open room for further strength, while a drop below $10.15 would suggest a corrective pullback toward support.
Earlier, analysts noted that Avalanche's bullish structure was being tempered by short-term overbought technical signals and the need for confirmation of a sustained directional move. The current data suggest this trend is intensifying, urging traders to monitor the $12.01 resistance closely as a breakout above this level may signal further upside potential.






Latest Avalanche News




-
 Afghanistan
-
 Albania
-
 Algeria
-
 Angola
-
 Argentina
-
 Armenia
-
 Australia
-
 Austria
-
 Azerbaijan
-
 Bahamas
-
 Bahrain
-
 Bangladesh
-
 Belarus
-
 Belgium
-
 Bolivia
-
 Botswana
-
 Brazil
-
 Brunei
-
 Bulgaria
-
 Cambodia
-
 Cameroon
-
 Canada
-
 Chile
-
 China
-
 Colombia
-
 Congo
-
 Costa Rica
-
 Cote d'Ivoire
-
 Croatia
-
 Cuba
-
 Cyprus
-
 Czechia
-
 DR Congo
-
 Denmark
-
 Dominican Republic
-
 Ecuador
-
 Egypt
-
 El Salvador
-
 Estonia
-
 Eswatini
-
 Ethiopia
-
 Finland
-
 France
-
 Georgia
-
 Germany
-
 Ghana
-
 Greece
-
 Haiti
-
 Hong Kong
-
 Hungary
-
 India
-
 Indonesia
-
 Iran, Islamic republic
-
 Iraq
-
 Ireland
-
 Israel
-
 Italy
-
 Jamaica
-
 Japan
-
 Jordan
-
 Kazakhstan
-
 Kenya
-
 Korea
-
 Kuwait
-
 Kyrgyzstan
-
 Laos
-
 Latvia
-
 Lebanon
-
 Lesotho
-
 Libya
-
 Lithuania
-
 Luxembourg
-
 Madagascar
-
 Malaysia
-
 Malta
-
 Mauritius
-
 Mexico
-
 Moldova
-
 Mongolia
-
 Montenegro
-
 Morocco
-
 Mozambique
-
 Myanmar
-
 Namibia
-
 Nepal
-
 Netherlands
-
 New Zealand
-
 Nigeria
-
 North Macedonia
-
 Norway
-
 Oman
-
 Pakistan
-
 Palestine
-
 Panama
-
 Papua New Guinea
-
 Paraguay
-
 Peru
-
 Philippines
-
 Poland
-
 Portugal
-
 Puerto Rico
-
 Qatar
-
 Reunion
-
 Romania
-
 Rwanda
-
 Saudi Arabia
-
 Serbia
-
 Singapore
-
 Slovakia
-
 Slovenia
-
 Somalia
-
 South Africa
-
 Spain
-
 Sri Lanka
-
 Sweden
-
 Switzerland
-
 Syria
-
 Taiwan
-
 Tajikistan
-
 Tanzania
-
 Thailand
-
 Trinidad and Tobago
-
 Tunisia
-
 Turkey
-
 UAE
-
 Uganda
-
 Ukraine
-
 United Kingdom
-
United States
-
 Uruguay
-
 Uzbekistan
-
 Venezuela
-
 Vietnam
-
 Yemen
-
 Zambia
-
 Zimbabwe
- Forex
- Crypto












