

Hedera weekly outlook: Can HBAR extend gains with enterprise adoption fueling trading volume?

Institutional demand has driven Hedera (HBAR) sharply higher over the past week, with the token trading near $0.11 after a nearly 10% move. Major enterprise adoption and product validation have set a strong tone, while buyers appear in control into the coming week — but momentum signals look stretched and volatility is elevated.
 0.0732
0.0781
Highlights
- Hedera trades at $0.1057, gaining 9.8% over the past 7 days and maintaining a bullish daily trend structure.
- Indicators signal strong upward momentum, with trend strength outweighing local pullback risk despite some oscillators nearing overbought levels.
- Next week, Hedera is expected to stay in a $0.0849 to $0.1264 range with key support at $0.1015 and resistance at $0.131.
Enterprise adoption accelerates after IBM Cloud listing spurs HBAR flows
HBAR rallied after its IDTrust identity management platform, developed by The Hashgraph Group, was validated and listed on the IBM Cloud Catalog, as confirmed by Yahoo Finance and multiple crypto-focused outlets on September 23, 2026. The IBM listing gives enterprise clients direct access to Hedera-based identity solutions through IBM's marketplace, spurring a notable rise in trading volume and open interest that points to greater institutional engagement. Unconfirmed speculation around potential tokenization of BlackRock’s money market fund also contributed to heightened activity, although no official confirmation has emerged as of October 2, 2026.
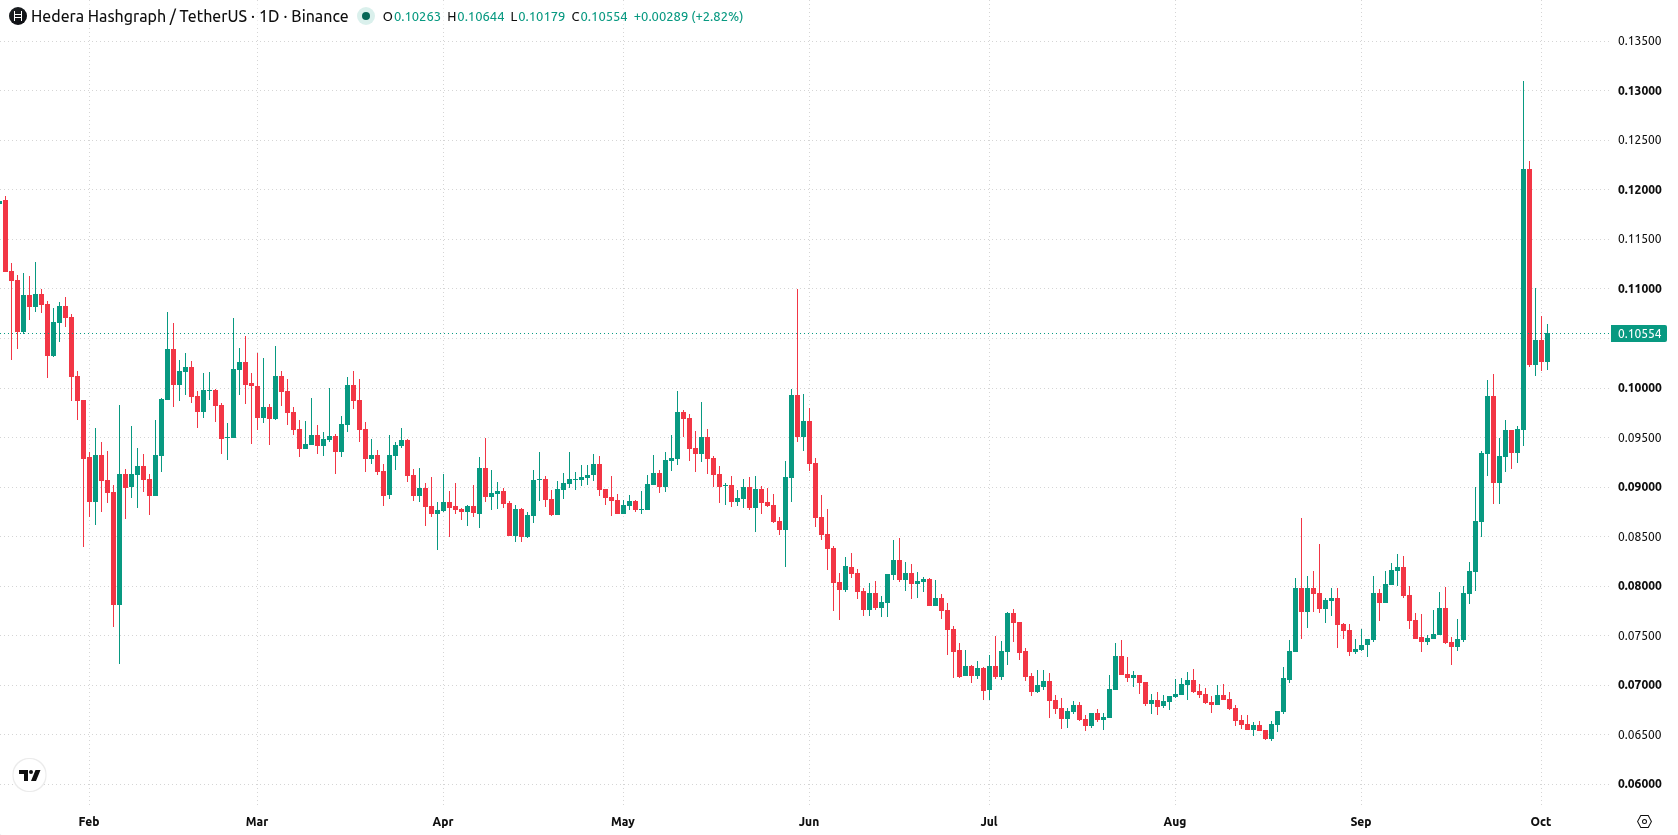
Trend strength dominates as bullish ADX offsets overbought indicators this week
On the daily chart, Hedera shows a sustained move higher with a firm trend, reinforced by a strong ADX reading of 44.3476 and a synchronously bullish MACD. However, oscillators diverge: both the RSI at 60.0108 and the CCI at 91.8659 are approaching overbought, while the Stoch RSI sits deep in the oversold zone. This mix of signals suggests that trend strength outweighs local pullback risk for now, especially with 42.7% volatility and support from the Ichimoku Kijun at $0.1015. Resistance is set at $0.131, marking last week’s high.
Upside bias prevails unless $0.1015 support breaks in the coming week
Next week, Hedera is expected to trade in a $0.0849 to $0.1264 range, with a very high probability of an increase and a very low probability of a decrease. The base case sees the price consolidating above $0.1015 support and below $0.131 resistance, driven by broad buy signals. A clear break above $0.131 could open further upside, while a close below $0.1015 would turn attention toward a deeper pullback within the forecast range.
Earlier, analysts noted that Hedera was showing bullish momentum despite undergoing significant volatility and renewed selling pressure. The current analysis strengthens this view by highlighting elevated institutional demand and technical trend strength, with next week’s focus on whether HBAR can sustain consolidation above the $0.1015 support amid heightened volatility.






Latest HBAR News




-
 Afghanistan
-
 Albania
-
 Algeria
-
 Angola
-
 Argentina
-
 Armenia
-
 Australia
-
 Austria
-
 Azerbaijan
-
 Bahamas
-
 Bahrain
-
 Bangladesh
-
 Belarus
-
 Belgium
-
 Bolivia
-
 Botswana
-
 Brazil
-
 Brunei
-
 Bulgaria
-
 Cambodia
-
 Cameroon
-
 Canada
-
 Chile
-
 China
-
 Colombia
-
 Congo
-
 Costa Rica
-
 Cote d'Ivoire
-
 Croatia
-
 Cuba
-
 Cyprus
-
 Czechia
-
 DR Congo
-
 Denmark
-
 Dominican Republic
-
 Ecuador
-
 Egypt
-
 El Salvador
-
 Estonia
-
 Eswatini
-
 Ethiopia
-
 Finland
-
 France
-
 Georgia
-
 Germany
-
 Ghana
-
 Greece
-
 Haiti
-
 Hong Kong
-
 Hungary
-
 India
-
 Indonesia
-
 Iran, Islamic republic
-
 Iraq
-
 Ireland
-
 Israel
-
 Italy
-
 Jamaica
-
 Japan
-
 Jordan
-
 Kazakhstan
-
 Kenya
-
 Korea
-
 Kuwait
-
 Kyrgyzstan
-
 Laos
-
 Latvia
-
 Lebanon
-
 Lesotho
-
 Libya
-
 Lithuania
-
 Luxembourg
-
 Madagascar
-
 Malaysia
-
 Malta
-
 Mauritius
-
 Mexico
-
 Moldova
-
 Mongolia
-
 Montenegro
-
 Morocco
-
 Mozambique
-
 Myanmar
-
 Namibia
-
 Nepal
-
 Netherlands
-
 New Zealand
-
 Nigeria
-
 North Macedonia
-
 Norway
-
 Oman
-
 Pakistan
-
 Palestine
-
 Panama
-
 Papua New Guinea
-
 Paraguay
-
 Peru
-
 Philippines
-
 Poland
-
 Portugal
-
 Puerto Rico
-
 Qatar
-
 Reunion
-
 Romania
-
 Rwanda
-
 Saudi Arabia
-
 Serbia
-
 Singapore
-
 Slovakia
-
 Slovenia
-
 Somalia
-
 South Africa
-
 Spain
-
 Sri Lanka
-
 Sweden
-
 Switzerland
-
 Syria
-
 Taiwan
-
 Tajikistan
-
 Tanzania
-
 Thailand
-
 Trinidad and Tobago
-
 Tunisia
-
 Turkey
-
 UAE
-
 Uganda
-
 Ukraine
-
 United Kingdom
-
United States
-
 Uruguay
-
 Uzbekistan
-
 Venezuela
-
 Vietnam
-
 Yemen
-
 Zambia
-
 Zimbabwe
- Forex
- Crypto












