

Arbitrum weekly outlook: Can ARB rebound as support comes into focus after a stretched decline?

Arbitrum (ARB) spent the past week under pressure near $0.20, sliding more than 11% after ongoing token unlocks and rising institutional attention shaped sentiment. Major institutional drivers and infrastructure partnerships have fueled both interest and volatility, leaving support dynamics in focus as the market adjusts to broad supply changes. Watching how these trends unfold will be important for traders in the coming week.
 0.1338
0.1690
Highlights
- Arbitrum dropped 11.24% over the past week, now trading at $0.1973 below its short-term moving average.
- Momentum and trend-following indicators send mixed signals, with oversold conditions suggesting potential for a short-term rebound.
- Expected price range for the next 7 days is $0.1717 to $0.2367, with support at $0.1935 and resistance at $0.1989.
Institutional adoption and monthly unlocks drive volatility and network expansion
A surge of institutional interest highlighted by Standard Chartered and others marked Arbitrum's increasing integration with the new Robinhood Chain, which sends a share of fees back to the ARB treasury. Recent volatility has been amplified by large monthly token unlocks, with Cryptoticker.io confirming that 92.6 million ARB are released each month until February 2027, adding consistent sell pressure. Upgrades like Elara and Robinhood's adoption of Arbitrum for tokenized equities in Europe may support continued network growth going forward.
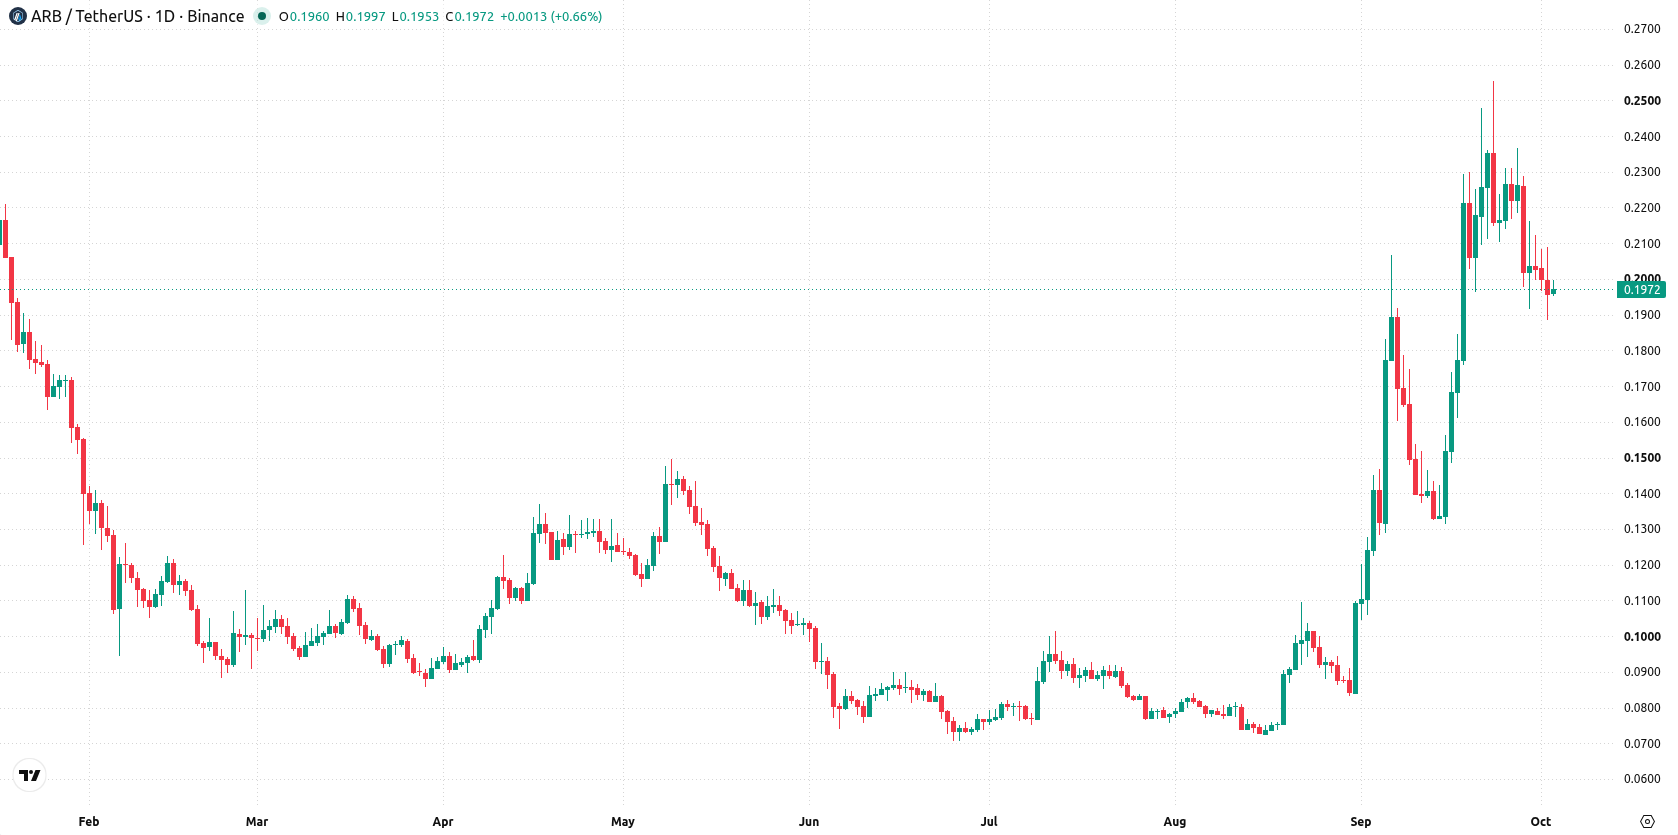
Divergence between momentum and trend signals as volatility stays elevated
On the daily chart, the structure is defined by a sustained move lower with a firm trend and stark weekly volatility at 25.64%. MACD signals "Strong Buy" while HMA carries a contrasting "Sell," highlighting an ongoing divergence between momentum and trend-following indicators. The RSI holds neutral at 52.7731, but Stoch RSI is deep in oversold territory, hinting at a possible short-term rebound attempt. Nearest support is at $0.1935 (Ichimoku Kijun), with immediate resistance at $0.1989 (MA-20), creating a tightly defined near-term pivot.
Upside bias favored if resistance breaks in next week’s defined range
For the next 7 days, the expected range is $0.1717 to $0.2367. There is a 71% probability of an increase and a 29% probability of a decrease. The base case envisions price trading between support at $0.1935 and resistance at $0.1989. A move above $0.1989 could see bullish momentum accelerate towards the top of the range. Conversely, a drop below $0.1935 would expose the pair to further downside toward $0.1717.
Earlier, analysts noted that Arbitrum was under continued selling pressure despite constructive long-term developments and increased institutional activity. The current analysis reinforces this caution, highlighting heightened volatility from large token unlocks and suggesting that sustained price action above $0.1935 could be critical for traders monitoring near-term bullish momentum.










-
 Afghanistan
-
 Albania
-
 Algeria
-
 Angola
-
 Argentina
-
 Armenia
-
 Australia
-
 Austria
-
 Azerbaijan
-
 Bahamas
-
 Bahrain
-
 Bangladesh
-
 Belarus
-
 Belgium
-
 Bolivia
-
 Botswana
-
 Brazil
-
 Brunei
-
 Bulgaria
-
 Cambodia
-
 Cameroon
-
 Canada
-
 Chile
-
 China
-
 Colombia
-
 Congo
-
 Costa Rica
-
 Cote d'Ivoire
-
 Croatia
-
 Cuba
-
 Cyprus
-
 Czechia
-
 DR Congo
-
 Denmark
-
 Dominican Republic
-
 Ecuador
-
 Egypt
-
 El Salvador
-
 Estonia
-
 Eswatini
-
 Ethiopia
-
 Finland
-
 France
-
 Georgia
-
 Germany
-
 Ghana
-
 Greece
-
 Haiti
-
 Hong Kong
-
 Hungary
-
 India
-
 Indonesia
-
 Iran, Islamic republic
-
 Iraq
-
 Ireland
-
 Israel
-
 Italy
-
 Jamaica
-
 Japan
-
 Jordan
-
 Kazakhstan
-
 Kenya
-
 Korea
-
 Kuwait
-
 Kyrgyzstan
-
 Laos
-
 Latvia
-
 Lebanon
-
 Lesotho
-
 Libya
-
 Lithuania
-
 Luxembourg
-
 Madagascar
-
 Malaysia
-
 Malta
-
 Mauritius
-
 Mexico
-
 Moldova
-
 Mongolia
-
 Montenegro
-
 Morocco
-
 Mozambique
-
 Myanmar
-
 Namibia
-
 Nepal
-
 Netherlands
-
 New Zealand
-
 Nigeria
-
 North Macedonia
-
 Norway
-
 Oman
-
 Pakistan
-
 Palestine
-
 Panama
-
 Papua New Guinea
-
 Paraguay
-
 Peru
-
 Philippines
-
 Poland
-
 Portugal
-
 Puerto Rico
-
 Qatar
-
 Reunion
-
 Romania
-
 Rwanda
-
 Saudi Arabia
-
 Serbia
-
 Singapore
-
 Slovakia
-
 Slovenia
-
 Somalia
-
 South Africa
-
 Spain
-
 Sri Lanka
-
 Sweden
-
 Switzerland
-
 Syria
-
 Taiwan
-
 Tajikistan
-
 Tanzania
-
 Thailand
-
 Trinidad and Tobago
-
 Tunisia
-
 Turkey
-
 UAE
-
 Uganda
-
 Ukraine
-
 United Kingdom
-
United States
-
 Uruguay
-
 Uzbekistan
-
 Venezuela
-
 Vietnam
-
 Yemen
-
 Zambia
-
 Zimbabwe
- Forex
- Crypto












