

Flow price prediction: Support pressure signals further risk below $0.029

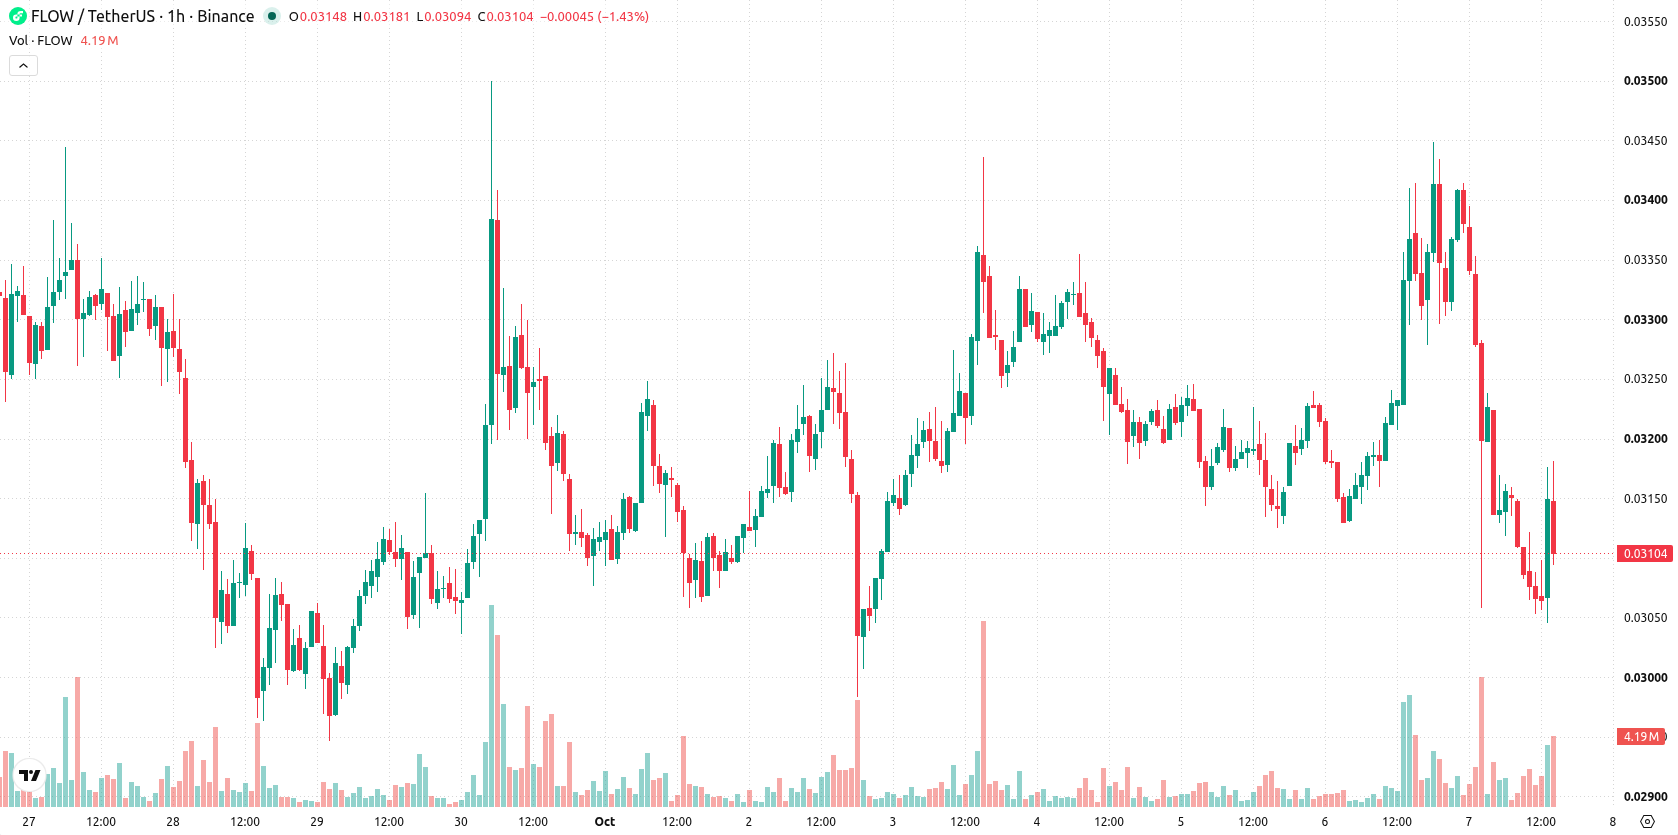
Flow (FLOW) is trading at $0.031, marking a daily decline of 7.88%. The asset is positioned below its key short- and medium-term moving averages, while holding above its longer-term average.
 0.0207
0.0231
Highlights
- FLOW/USD trades below key short- and medium-term moving averages, indicating prevalent intraday and multi-session selling pressure.
- Momentum, MACD, ADX, and supporting indicators reflect dominant bearish control with oversold signals in place.
- Price stands at $0.031, down 7.88% on high volatility, with an expected range of $0.029 to $0.0321 and a 73% probability of further downside.
Bearish pressure persists as indicators warn of extended selling
On the hourly chart, FLOW is trading below the MA-20 and MA-50, while remaining above the daily MA-200. The Ichimoku Kijun at $0.0325 stands as immediate resistance. Momentum indicators continue to signal selling pressure, with both MACD and ADX maintaining a sell bias. RSI, CCI, and Stochastic RSI are in oversold territory, indicating the market could be extended to the downside. Bull/Bear Power confirms strong intraday seller dominance, and the Awesome Oscillator supports the current bearish momentum.
Sideways trade expected as volatility and downside risk build
Looking forward, the expected price range for FLOW over the next 2 to 3 sessions is $0.029 to $0.0321, representing a volatility band relative to current levels. The probability of further downside is estimated at 73%, while the chance of a short-term recovery stands at 27%. The base case scenario is for limited sideways movement within this channel, with resistance at $0.0325 for any potential bullish breakout and a risk of accelerated declines if $0.029 is breached.
Earlier, analysts noted a shift in Flow toward decisive bullish momentum as buyers took control. The current reversal to bearish conditions highlights a change in trend, with traders now watching the $0.029 support level as the critical threshold for downside risk in the coming sessions.










-
 Afghanistan
-
 Albania
-
 Algeria
-
 Angola
-
 Argentina
-
 Armenia
-
 Australia
-
 Austria
-
 Azerbaijan
-
 Bahamas
-
 Bahrain
-
 Bangladesh
-
 Belarus
-
 Belgium
-
 Bolivia
-
 Botswana
-
 Brazil
-
 Brunei
-
 Bulgaria
-
 Cambodia
-
 Cameroon
-
 Canada
-
 Chile
-
 China
-
 Colombia
-
 Congo
-
 Costa Rica
-
 Cote d'Ivoire
-
 Croatia
-
 Cuba
-
 Cyprus
-
 Czechia
-
 DR Congo
-
 Denmark
-
 Dominican Republic
-
 Ecuador
-
 Egypt
-
 El Salvador
-
 Estonia
-
 Eswatini
-
 Ethiopia
-
 Finland
-
 France
-
 Georgia
-
 Germany
-
 Ghana
-
 Greece
-
 Haiti
-
 Hong Kong
-
 Hungary
-
 India
-
 Indonesia
-
 Iran, Islamic republic
-
 Iraq
-
 Ireland
-
 Israel
-
 Italy
-
 Jamaica
-
 Japan
-
 Jordan
-
 Kazakhstan
-
 Kenya
-
 Korea
-
 Kuwait
-
 Kyrgyzstan
-
 Laos
-
 Latvia
-
 Lebanon
-
 Lesotho
-
 Libya
-
 Lithuania
-
 Luxembourg
-
 Madagascar
-
 Malaysia
-
 Malta
-
 Mauritius
-
 Mexico
-
 Moldova
-
 Mongolia
-
 Montenegro
-
 Morocco
-
 Mozambique
-
 Myanmar
-
 Namibia
-
 Nepal
-
 Netherlands
-
 New Zealand
-
 Nigeria
-
 North Macedonia
-
 Norway
-
 Oman
-
 Pakistan
-
 Palestine
-
 Panama
-
 Papua New Guinea
-
 Paraguay
-
 Peru
-
 Philippines
-
 Poland
-
 Portugal
-
 Puerto Rico
-
 Qatar
-
 Reunion
-
 Romania
-
 Rwanda
-
 Saudi Arabia
-
 Serbia
-
 Singapore
-
 Slovakia
-
 Slovenia
-
 Somalia
-
 South Africa
-
 Spain
-
 Sri Lanka
-
 Sweden
-
 Switzerland
-
 Syria
-
 Taiwan
-
 Tajikistan
-
 Tanzania
-
 Thailand
-
 Trinidad and Tobago
-
 Tunisia
-
 Turkey
-
 UAE
-
 Uganda
-
 Ukraine
-
 United Kingdom
-
United States
-
 Uruguay
-
 Uzbekistan
-
 Venezuela
-
 Vietnam
-
 Yemen
-
 Zambia
-
 Zimbabwe
- Forex
- Crypto












