

Can October 5 intraday drop pressure weigh on Stellar?

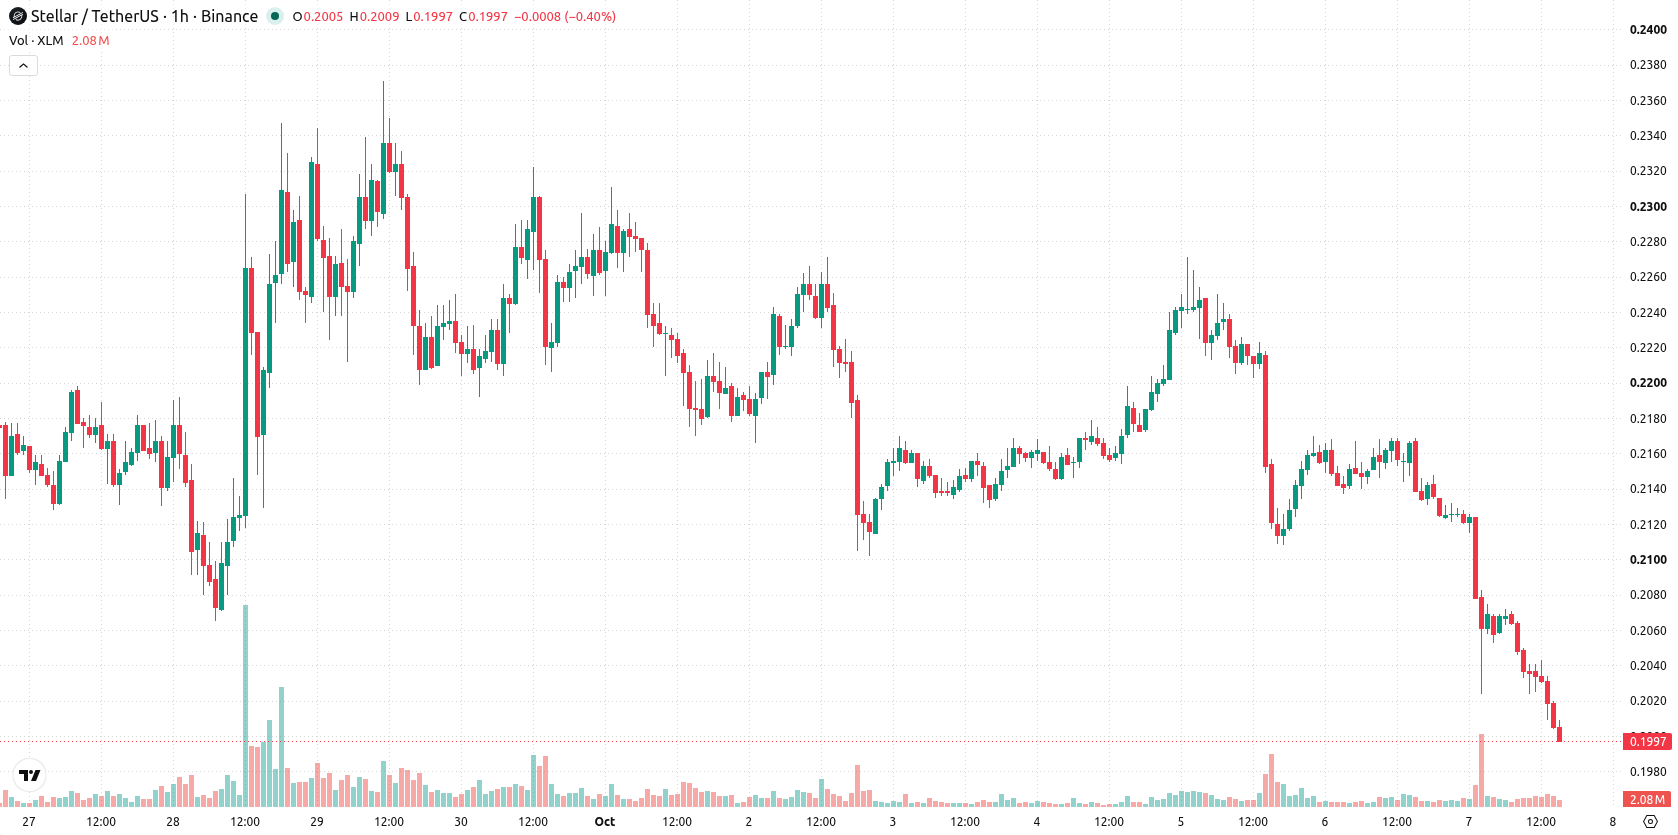
Stellar (XLM) is trading at $0.2003, sharply lower on the day with a decline of 7.27%. The price has moved below its key moving averages in the short and medium term, while remaining above its longer-term threshold.
 0.1632
0.1752
Highlights
- Stellar Lumens dropped 3.01% within one hour on October 5, experiencing acute sell pressure and increased volatility.
- In Q2 2026, the Stellar network surpassed $3 billion in tokenized assets and $11.4 billion in stablecoin transfer volume.
- XLM trades below short- and medium-term moving averages, with strong bearish momentum and a projected range of $0.1956 to $0.205 for the next two to three days.
Intensified sell pressure adds volatility as sentiment turns negative
According to Pluang, Stellar Lumens suffered a sharp intraday drop of 3.01% within a single hour on October 5, reflecting acute sell pressure and likely triggering increased market volatility. This sudden move may have compounded negative sentiment and contributed to accelerated downside in XLM. Previously, in Q2 2026, the network achieved notable milestones by surpassing $3 billion in tokenized assets and reaching $11.4 billion in stablecoin transfer volume, though these achievements serve primarily as historical context for ecosystem activity.
Bearish momentum confirmed as support holds amid oversold signals
On the technical front, XLM is trading below the MA-20 ($0.2072) and MA-50 ($0.2118) on the hourly chart, with price action remaining above the longer-term MA-200 ($0.1812) based on daily data. The nearest resistance is set by the Ichimoku Kijun level at $0.2089. Momentum indicators reinforce the prevailing bearish tone: MACD and ADX are both on sell signals, while RSI stands extremely low at 18.7. Stoch RSI and CCI are in deep oversold territory. Bull/Bear Power highlights seller dominance on the intraday timeframe, and the Awesome Oscillator also points to ongoing downside momentum.
Downside risk elevated as breakout levels define near-term range
Looking ahead over the next two to three trading days, XLM is expected to trade within a band from $0.1956 to $0.205. The probability of a further drop is high, with upward movement considered unlikely in the near term. The baseline scenario anticipates near-term stabilization inside this range; a clear bullish reversal would require a move above resistance at $0.2089, while a sustained breach beneath $0.1956 could open the door to accelerated declines.
Previously it was reported that institutional activity and on-chain developments had established a supportive backdrop for Stellar, positioning the asset for potential long-term growth. The current technical breakdown, however, signals a notable shift, with traders advised to monitor the $0.1956 level as a decisive threshold for further downside risk in the days ahead.











-
 Afghanistan
-
 Albania
-
 Algeria
-
 Angola
-
 Argentina
-
 Armenia
-
 Australia
-
 Austria
-
 Azerbaijan
-
 Bahamas
-
 Bahrain
-
 Bangladesh
-
 Belarus
-
 Belgium
-
 Bolivia
-
 Botswana
-
 Brazil
-
 Brunei
-
 Bulgaria
-
 Cambodia
-
 Cameroon
-
 Canada
-
 Chile
-
 China
-
 Colombia
-
 Congo
-
 Costa Rica
-
 Cote d'Ivoire
-
 Croatia
-
 Cuba
-
 Cyprus
-
 Czechia
-
 DR Congo
-
 Denmark
-
 Dominican Republic
-
 Ecuador
-
 Egypt
-
 El Salvador
-
 Estonia
-
 Eswatini
-
 Ethiopia
-
 Finland
-
 France
-
 Georgia
-
 Germany
-
 Ghana
-
 Greece
-
 Haiti
-
 Hong Kong
-
 Hungary
-
 India
-
 Indonesia
-
 Iran, Islamic republic
-
 Iraq
-
 Ireland
-
 Israel
-
 Italy
-
 Jamaica
-
 Japan
-
 Jordan
-
 Kazakhstan
-
 Kenya
-
 Korea
-
 Kuwait
-
 Kyrgyzstan
-
 Laos
-
 Latvia
-
 Lebanon
-
 Lesotho
-
 Libya
-
 Lithuania
-
 Luxembourg
-
 Madagascar
-
 Malaysia
-
 Malta
-
 Mauritius
-
 Mexico
-
 Moldova
-
 Mongolia
-
 Montenegro
-
 Morocco
-
 Mozambique
-
 Myanmar
-
 Namibia
-
 Nepal
-
 Netherlands
-
 New Zealand
-
 Nigeria
-
 North Macedonia
-
 Norway
-
 Oman
-
 Pakistan
-
 Palestine
-
 Panama
-
 Papua New Guinea
-
 Paraguay
-
 Peru
-
 Philippines
-
 Poland
-
 Portugal
-
 Puerto Rico
-
 Qatar
-
 Reunion
-
 Romania
-
 Rwanda
-
 Saudi Arabia
-
 Serbia
-
 Singapore
-
 Slovakia
-
 Slovenia
-
 Somalia
-
 South Africa
-
 Spain
-
 Sri Lanka
-
 Sweden
-
 Switzerland
-
 Syria
-
 Taiwan
-
 Tajikistan
-
 Tanzania
-
 Thailand
-
 Trinidad and Tobago
-
 Tunisia
-
 Turkey
-
 UAE
-
 Uganda
-
 Ukraine
-
 United Kingdom
-
United States
-
 Uruguay
-
 Uzbekistan
-
 Venezuela
-
 Vietnam
-
 Yemen
-
 Zambia
-
 Zimbabwe
- Forex
- Crypto












