

Render slides more than 10% as short-term technical weakness triggers selling

Render Network (RENDER) slumped 10.39% today as technical selling pressure accelerated following a loss of short-term momentum below the 20-day moving average. This pullback is being limited by medium- and long-term support from higher moving averages, with $1.7425 acting as a key downside floor.
 1.585
1.7710
Highlights
- RENDER/USD trades below its 20-day moving average, indicating short-term seller pressure within a longer-term uptrend.
- Momentum indicators mostly suggest upside potential, though several oscillators indicate an approach toward overbought conditions.
- The pair is projected to trade in a $1.6665 to $2.045 range over five days, with over an 80% probability of an upward move.
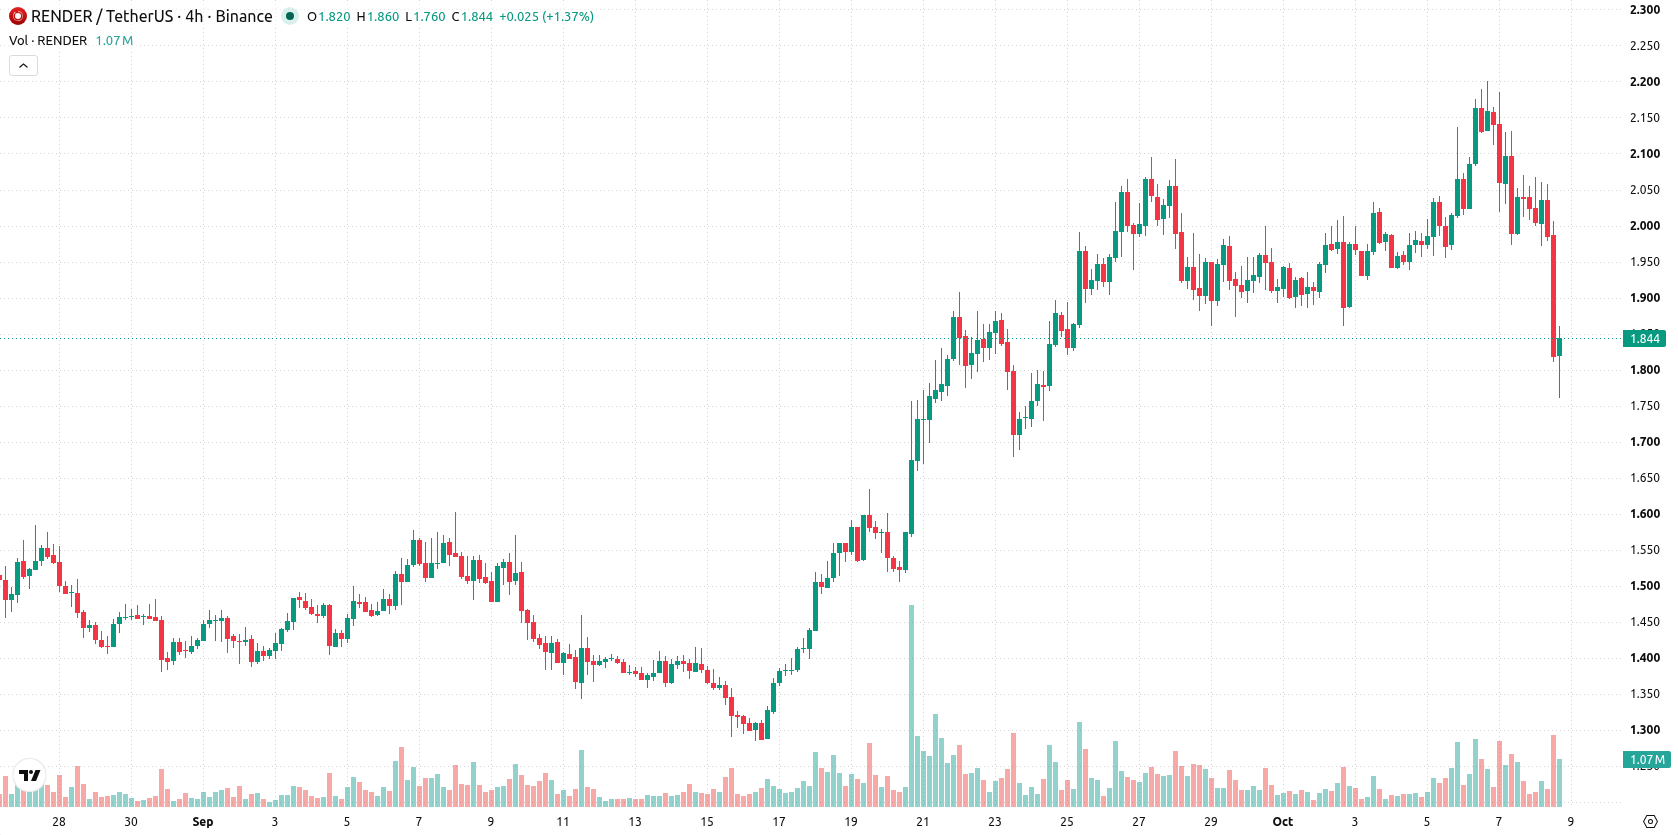
Short-term selling meets bullish momentum amid overbought warnings
RENDER/USD is currently trading below the 20-day moving average at $1.901, but remains above the 50-day and 200-day moving averages at $1.6278 and $1.6767. This suggests there is short-term selling pressure but ongoing support for the pair’s medium- and long-term uptrend, with $1.86 serving as the near-term resistance and Ichimoku Kijun support at $1.7425 providing a significant floor. Momentum readings remain broadly bullish, as the MACD and ADX back an upward move, while the RSI, CCI, and Stochastic RSI warn that the pair is nearing overbought—though the Stochastic RSI now points to an 'Oversold' condition. Bull/Bear Power shows buyers dominate intraday, with the Awesome Oscillator supporting the bullish tone. Intraday volatility is elevated at 5.56%, and RENDER/USD remains near its daily lows after a downside gap, signaling mild pressure even as momentum signals are positive. Oscillators currently indicate a degree of short-term caution.
Earlier, analysts noted that Render was experiencing sustained selling momentum and a pronounced downside bias amid heightened volatility. The latest technical signals now point to a potential rebound, with traders advised to monitor for a decisive move above $1.86 as a trigger for renewed upward momentum within the current volatility band.










-
 Afghanistan
-
 Albania
-
 Algeria
-
 Angola
-
 Argentina
-
 Armenia
-
 Australia
-
 Austria
-
 Azerbaijan
-
 Bahamas
-
 Bahrain
-
 Bangladesh
-
 Belarus
-
 Belgium
-
 Bolivia
-
 Botswana
-
 Brazil
-
 Brunei
-
 Bulgaria
-
 Cambodia
-
 Cameroon
-
 Canada
-
 Chile
-
 China
-
 Colombia
-
 Congo
-
 Costa Rica
-
 Cote d'Ivoire
-
 Croatia
-
 Cuba
-
 Cyprus
-
 Czechia
-
 DR Congo
-
 Denmark
-
 Dominican Republic
-
 Ecuador
-
 Egypt
-
 El Salvador
-
 Estonia
-
 Eswatini
-
 Ethiopia
-
 Finland
-
 France
-
 Georgia
-
 Germany
-
 Ghana
-
 Greece
-
 Haiti
-
 Hong Kong
-
 Hungary
-
 India
-
 Indonesia
-
 Iran, Islamic republic
-
 Iraq
-
 Ireland
-
 Israel
-
 Italy
-
 Jamaica
-
 Japan
-
 Jordan
-
 Kazakhstan
-
 Kenya
-
 Korea
-
 Kuwait
-
 Kyrgyzstan
-
 Laos
-
 Latvia
-
 Lebanon
-
 Lesotho
-
 Libya
-
 Lithuania
-
 Luxembourg
-
 Madagascar
-
 Malaysia
-
 Malta
-
 Mauritius
-
 Mexico
-
 Moldova
-
 Mongolia
-
 Montenegro
-
 Morocco
-
 Mozambique
-
 Myanmar
-
 Namibia
-
 Nepal
-
 Netherlands
-
 New Zealand
-
 Nigeria
-
 North Macedonia
-
 Norway
-
 Oman
-
 Pakistan
-
 Palestine
-
 Panama
-
 Papua New Guinea
-
 Paraguay
-
 Peru
-
 Philippines
-
 Poland
-
 Portugal
-
 Puerto Rico
-
 Qatar
-
 Reunion
-
 Romania
-
 Rwanda
-
 Saudi Arabia
-
 Serbia
-
 Singapore
-
 Slovakia
-
 Slovenia
-
 Somalia
-
 South Africa
-
 Spain
-
 Sri Lanka
-
 Sweden
-
 Switzerland
-
 Syria
-
 Taiwan
-
 Tajikistan
-
 Tanzania
-
 Thailand
-
 Trinidad and Tobago
-
 Tunisia
-
 Turkey
-
 UAE
-
 Uganda
-
 Ukraine
-
 United Kingdom
-
United States
-
 Uruguay
-
 Uzbekistan
-
 Venezuela
-
 Vietnam
-
 Yemen
-
 Zambia
-
 Zimbabwe
- Forex
- Crypto












