

What's behind Curve's latest 10.7% price pullback?

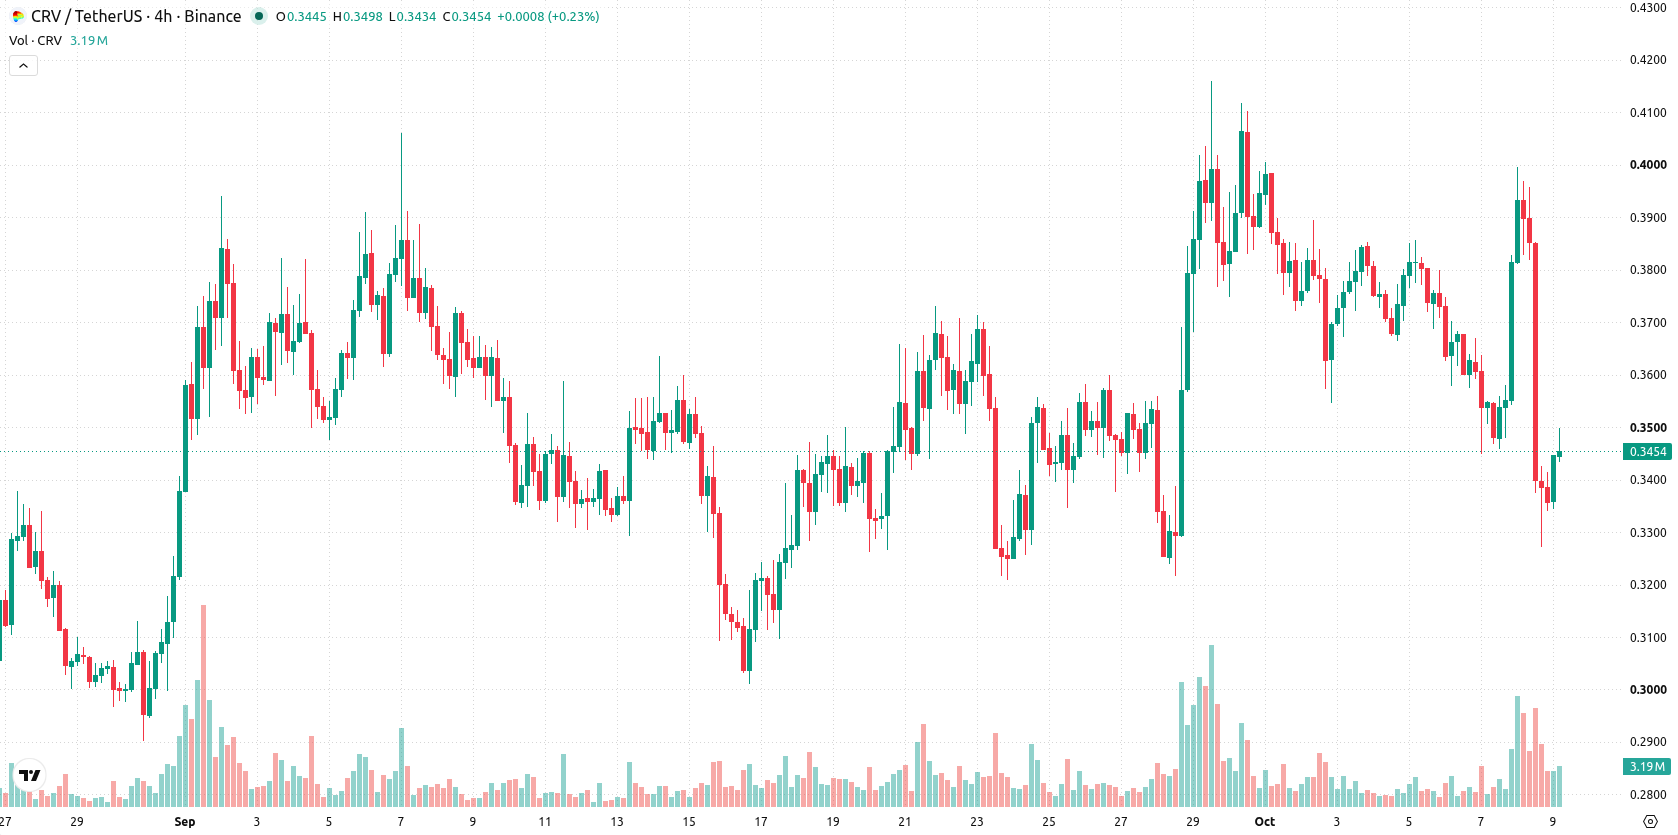
Curve (CRV) slid 10.71% as renewed selling pressure dominated, even as on-chain platform activity reached elevated levels. The latest move looks limited, with CRV still trapped below the 20- and 50-day moving averages and only the 200-day average providing longer-term support.
 0.2018
0.2428
Highlights
- Active loans on the Curve platform rose to $76.18 million and total staked volume stayed above $300 million for two days.
- Network revenue reached $158,000, indicating higher lending activity and increased on-chain participation in the Curve ecosystem.
- CRV/USD trades below short- and medium-term moving averages with selling pressure; forecast range for the next five days is $0.3088 to $0.3812.
On-chain engagement surges as market shrugs off lending resurgence
Active loans on the Curve platform reached $76.18 million, accompanied by a two-day period of total staked volume above $300 million. Network revenue was reported at $158,000, reflecting increased lending activity. These developments indicated heightened on-chain engagement and recovering activity within the Curve ecosystem, though price action has remained under broader selling pressure.
Mixed momentum and conflicting signals as CRV tests technical boundaries
CRV/USD is trading below the 20-day and 50-day moving averages at $0.3635 and $0.3483, which signals persistent short- and medium-term pressure from sellers. The price remains above the 200-day moving average at $0.2535, indicating longer-term support and a bullish structural alignment. Short-term ceiling and floor levels are defined at $0.3483 and $0.3409. Momentum readings are mixed: the MACD and ADX signal underlying buy momentum, but the RSI sits at 45 with a 'Sell' forecast, and the Stochastic RSI shows the market as oversold. The CCI is neutral. Bull/Bear Power is slightly positive, confirming mild buyer dominance intraday. The day began with a downside gap of about $0.0505 or 13.07%. The current price of $0.345 is near the session high, with intraday volatility at 1.97% and a tone of early strength toward session highs against conflicting signals from oscillators and momentum indicators.
Earlier, analysts noted that Curve was displaying underlying bullish momentum supported by trend strength across multiple timeframes. The current analysis signals a shift in the short-term outlook, with price now pressured below key moving averages and traders advised to monitor the $0.3483 resistance level as a potential trigger for renewed upside or breakdown risk.









-
 Afghanistan
-
 Albania
-
 Algeria
-
 Angola
-
 Argentina
-
 Armenia
-
 Australia
-
 Austria
-
 Azerbaijan
-
 Bahamas
-
 Bahrain
-
 Bangladesh
-
 Belarus
-
 Belgium
-
 Bolivia
-
 Botswana
-
 Brazil
-
 Brunei
-
 Bulgaria
-
 Cambodia
-
 Cameroon
-
 Canada
-
 Chile
-
 China
-
 Colombia
-
 Congo
-
 Costa Rica
-
 Cote d'Ivoire
-
 Croatia
-
 Cuba
-
 Cyprus
-
 Czechia
-
 DR Congo
-
 Denmark
-
 Dominican Republic
-
 Ecuador
-
 Egypt
-
 El Salvador
-
 Estonia
-
 Eswatini
-
 Ethiopia
-
 Finland
-
 France
-
 Georgia
-
 Germany
-
 Ghana
-
 Greece
-
 Haiti
-
 Hong Kong
-
 Hungary
-
 India
-
 Indonesia
-
 Iran, Islamic republic
-
 Iraq
-
 Ireland
-
 Israel
-
 Italy
-
 Jamaica
-
 Japan
-
 Jordan
-
 Kazakhstan
-
 Kenya
-
 Korea
-
 Kuwait
-
 Kyrgyzstan
-
 Laos
-
 Latvia
-
 Lebanon
-
 Lesotho
-
 Libya
-
 Lithuania
-
 Luxembourg
-
 Madagascar
-
 Malaysia
-
 Malta
-
 Mauritius
-
 Mexico
-
 Moldova
-
 Mongolia
-
 Montenegro
-
 Morocco
-
 Mozambique
-
 Myanmar
-
 Namibia
-
 Nepal
-
 Netherlands
-
 New Zealand
-
 Nigeria
-
 North Macedonia
-
 Norway
-
 Oman
-
 Pakistan
-
 Palestine
-
 Panama
-
 Papua New Guinea
-
 Paraguay
-
 Peru
-
 Philippines
-
 Poland
-
 Portugal
-
 Puerto Rico
-
 Qatar
-
 Reunion
-
 Romania
-
 Rwanda
-
 Saudi Arabia
-
 Serbia
-
 Singapore
-
 Slovakia
-
 Slovenia
-
 Somalia
-
 South Africa
-
 Spain
-
 Sri Lanka
-
 Sweden
-
 Switzerland
-
 Syria
-
 Taiwan
-
 Tajikistan
-
 Tanzania
-
 Thailand
-
 Trinidad and Tobago
-
 Tunisia
-
 Turkey
-
 UAE
-
 Uganda
-
 Ukraine
-
 United Kingdom
-
United States
-
 Uruguay
-
 Uzbekistan
-
 Venezuela
-
 Vietnam
-
 Yemen
-
 Zambia
-
 Zimbabwe
- Forex
- Crypto












