

Pendle technical analysis: Selloff accelerates below $2 support

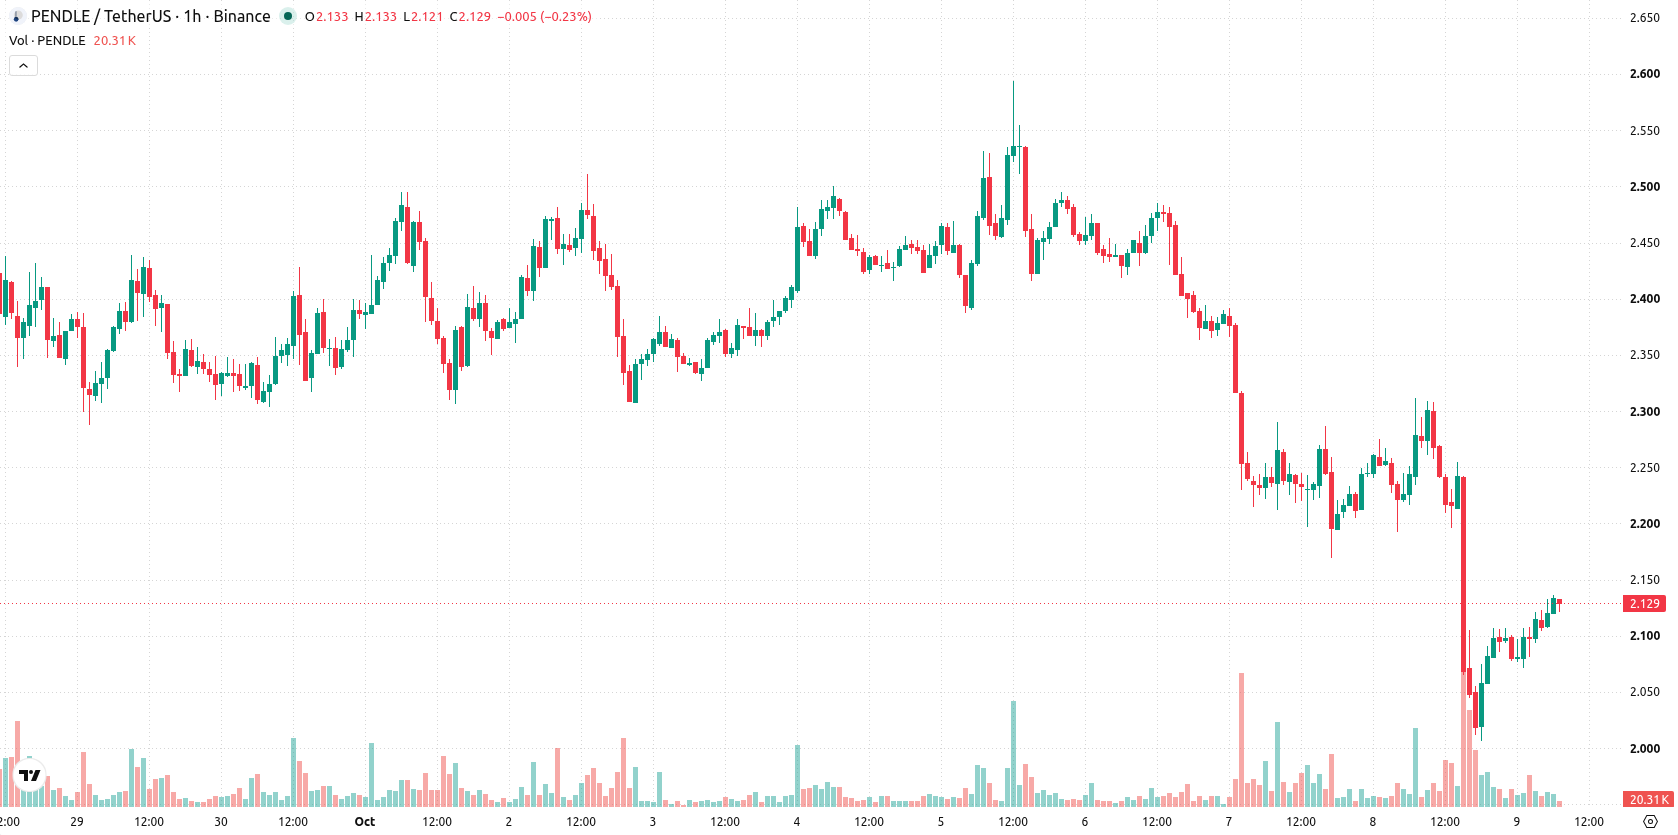
Pendle (PENDLE) is trading at $2.131, down 7.51% on the day. The asset trades above its key short-term averages but remains below intermediate benchmarks, maintaining a position of recent volatility.
 1.461
1.5980
Highlights
- Pendle is advancing real-world asset integration through an onchain tokenized $2.4 billion infrastructure strategy and collaborative DeFi-tradfi initiatives.
- Platform developments include new yield strategies, partnerships with Partners Group, and joint activity with Aave on tokenized yield products.
- Pendle trades with short-term upward momentum but faces medium-term resistance and maintains a projected range of $1.9995 to $2.2625 over the next 2 to 3 days.
Real-world asset tokenization boosts utility amid sustained selling pressure
Pendle has launched the RWA Insights series, featuring a $2.4 billion infrastructure strategy being tokenized onchain to advance real-world asset integration into its platform, according to Coinfomania. This initiative demonstrates the platform’s execution in integrating tangible assets, potentially broadening its use case and attracting new forms of capital. Additional developments include the rollout of new yield strategies at Token2049, enhanced DeFi-traditional finance connectivity through recent collaborations such as with Partners Group, and joint activity with Aave on tokenized yield products, as reported by Coinfomania and Diariobitcoin, though price action has remained under broader selling pressure.
Momentum divergence emerges as key indicators reinforce mixed signals
Technically, PENDLE is trading above the MA-20 at $2.1156 but remains below the MA-50 at $2.1916 on the H1 chart, with the MA-200 providing broad longer-term support at $1.6124. Immediate resistance is defined by the Ichimoku Kijun at $2.159. On the indicator front, both MACD and ADX signal clear selling pressure, while RSI stands at 46.45 (Sell). The Stochastic RSI shows an overbought reading, suggesting potential for a reversal or near-term exhaustion. Bull/Bear Power points to buyer dominance intraday, but CCI and the Awesome Oscillator both remain neutral, highlighting a divergence between the momentum signals and intraday buying flows.
Potential for downside consolidates as resistance lines guide direction
Over the next 2 to 3 trading days, PENDLE is likely to trade within a volatility band between $1.9995 and $2.2625, with a 55% probability of further downside and 45% potential for an upward rebound. The baseline scenario foresees price consolidation within this corridor. A sustained move above the $2.159 resistance could trigger a bullish breakout, while a breakdown below $2.00 may accelerate negative momentum and deepen the decline.
Earlier, analysts noted that Pendle was under persistent selling pressure despite ongoing ecosystem developments and continued weakness in technical indicators. The current article strengthens this view by highlighting prevailing downside risks amid recent volatility, with short-term consolidation expected as traders monitor any sustained move above $2.159 for potential reversal or a breakdown below $2.00 as a signal for deeper declines.










-
 Afghanistan
-
 Albania
-
 Algeria
-
 Angola
-
 Argentina
-
 Armenia
-
 Australia
-
 Austria
-
 Azerbaijan
-
 Bahamas
-
 Bahrain
-
 Bangladesh
-
 Belarus
-
 Belgium
-
 Bolivia
-
 Botswana
-
 Brazil
-
 Brunei
-
 Bulgaria
-
 Cambodia
-
 Cameroon
-
 Canada
-
 Chile
-
 China
-
 Colombia
-
 Congo
-
 Costa Rica
-
 Cote d'Ivoire
-
 Croatia
-
 Cuba
-
 Cyprus
-
 Czechia
-
 DR Congo
-
 Denmark
-
 Dominican Republic
-
 Ecuador
-
 Egypt
-
 El Salvador
-
 Estonia
-
 Eswatini
-
 Ethiopia
-
 Finland
-
 France
-
 Georgia
-
 Germany
-
 Ghana
-
 Greece
-
 Haiti
-
 Hong Kong
-
 Hungary
-
 India
-
 Indonesia
-
 Iran, Islamic republic
-
 Iraq
-
 Ireland
-
 Israel
-
 Italy
-
 Jamaica
-
 Japan
-
 Jordan
-
 Kazakhstan
-
 Kenya
-
 Korea
-
 Kuwait
-
 Kyrgyzstan
-
 Laos
-
 Latvia
-
 Lebanon
-
 Lesotho
-
 Libya
-
 Lithuania
-
 Luxembourg
-
 Madagascar
-
 Malaysia
-
 Malta
-
 Mauritius
-
 Mexico
-
 Moldova
-
 Mongolia
-
 Montenegro
-
 Morocco
-
 Mozambique
-
 Myanmar
-
 Namibia
-
 Nepal
-
 Netherlands
-
 New Zealand
-
 Nigeria
-
 North Macedonia
-
 Norway
-
 Oman
-
 Pakistan
-
 Palestine
-
 Panama
-
 Papua New Guinea
-
 Paraguay
-
 Peru
-
 Philippines
-
 Poland
-
 Portugal
-
 Puerto Rico
-
 Qatar
-
 Reunion
-
 Romania
-
 Rwanda
-
 Saudi Arabia
-
 Serbia
-
 Singapore
-
 Slovakia
-
 Slovenia
-
 Somalia
-
 South Africa
-
 Spain
-
 Sri Lanka
-
 Sweden
-
 Switzerland
-
 Syria
-
 Taiwan
-
 Tajikistan
-
 Tanzania
-
 Thailand
-
 Trinidad and Tobago
-
 Tunisia
-
 Turkey
-
 UAE
-
 Uganda
-
 Ukraine
-
 United Kingdom
-
United States
-
 Uruguay
-
 Uzbekistan
-
 Venezuela
-
 Vietnam
-
 Yemen
-
 Zambia
-
 Zimbabwe
- Forex
- Crypto












