

Saros slumps around 14.5% as persistent technical selling pressure weighs on price

Saros (SAROS) slumped 14.51% as persistent technical selling pressure drove prices downward, lacking any fresh fundamental catalyst. The downside move is supported by Saros trading below its 200-day moving average, with the longer-term trend remaining bearish despite pockets of strong momentum.
 0.0004
0.000730
0.0004
0.000730
Highlights
- SAROS/USD trades above all major moving averages, with technical signals broadly supportive of buyers across timeframes.
- Intraday volatility is high at 33.33%, with price holding near the session high after a 14.51% decline.
- The expected price range over the next 5 days is $0.0003 to $0.0009, with over 80% probability of an upward move.
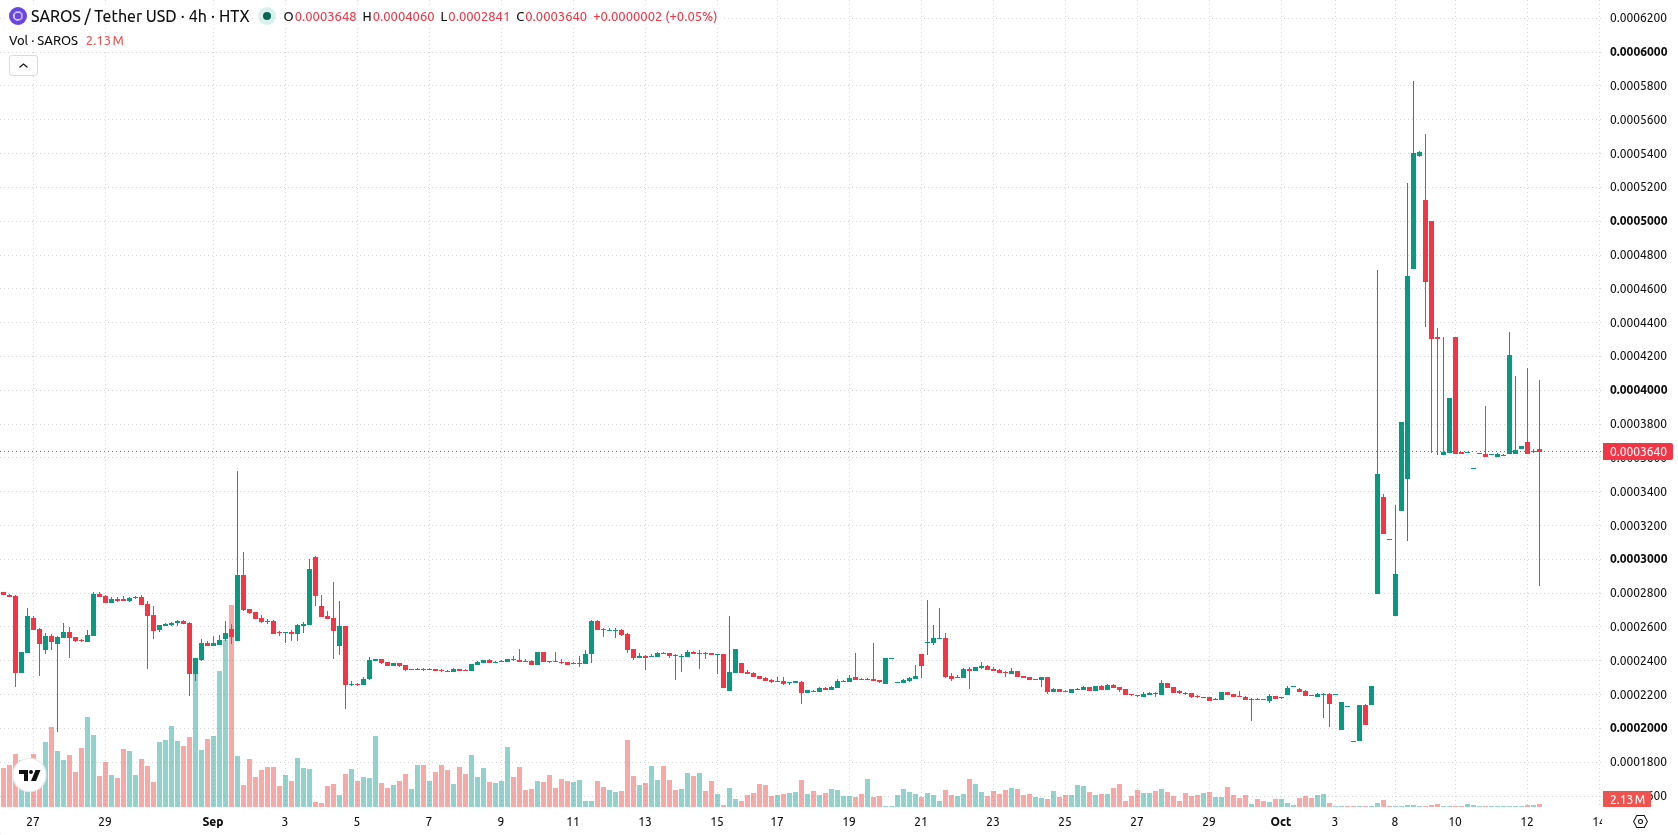
Positive short-term momentum persists amid longer-term bearish trend
SAROS/USD is trading above its 20-day, 50-day, and 200-day moving averages ($0.0003, $0.0003, and $0.0004 respectively), indicating positive momentum across short-, medium-, and long-term periods. The nearest resistance is at $0.0005 (Ichimoku Kijun), while support lies at $0.0003 (MA-20). However, the longer-term trend remains bearish due to the configuration of the 50-day versus 200-day averages. Broadly supportive momentum readings are observed: the MACD and ADX both exhibit strength, with the ADX above 36. The RSI is firm at 61 and signals a buy, which aligns with a bullish CCI and a 'Strong Buy' from the BBP, together suggesting that buyers currently dominate intraday momentum. The Awesome Oscillator also remains positive. A downside gap of approximately 25% is reflected in today's 14.51% decline, and intraday volatility stands at 33.33%. The Stochastic RSI is neutral, signaling no immediate overbought or oversold risks, as early downside pressure is countered by persistent bullish momentum.
Earlier, analysts noted that Saros was constrained by persistent bearish momentum and faced limited prospects for near-term upside. The latest technical configuration now signals a pronounced shift toward bullish intraday momentum, making the $0.0005 level a critical resistance to monitor for confirmation of sustained upside.










-
 Afghanistan
-
 Albania
-
 Algeria
-
 Angola
-
 Argentina
-
 Armenia
-
 Australia
-
 Austria
-
 Azerbaijan
-
 Bahamas
-
 Bahrain
-
 Bangladesh
-
 Belarus
-
 Belgium
-
 Bolivia
-
 Botswana
-
 Brazil
-
 Brunei
-
 Bulgaria
-
 Cambodia
-
 Cameroon
-
 Canada
-
 Chile
Chile
-
 China
China
-
 Colombia
-
 Congo
Congo
-
 Costa Rica
-
 Cote d'Ivoire
-
 Croatia
-
 Cuba
Cuba
-
 Cyprus
-
 Czechia
-
 DR Congo
-
 Denmark
-
 Dominican Republic
-
 Ecuador
-
 Egypt
Egypt
-
 El Salvador
-
 Estonia
-
 Eswatini
-
 Ethiopia
-
 Finland
-
 France
-
 Georgia
-
 Germany
-
 Ghana
Ghana
-
 Greece
-
 Haiti
Haiti
-
 Hong Kong
-
 Hungary
-
 India
India
-
 Indonesia
-
 Iran, Islamic republic
-
 Iraq
Iraq
-
 Ireland
-
 Israel
-
 Italy
Italy
-
 Jamaica
-
 Japan
Japan
-
 Jordan
-
 Kazakhstan
-
 Kenya
Kenya
-
 Korea
Korea
-
 Kuwait
-
 Kyrgyzstan
-
 Laos
Laos
-
 Latvia
-
 Lebanon
-
 Lesotho
-
 Libya
Libya
-
 Lithuania
-
 Luxembourg
-
 Madagascar
-
 Malaysia
-
 Malta
Malta
-
 Mauritius
-
 Mexico
-
 Moldova
-
 Mongolia
-
 Montenegro
-
 Morocco
-
 Mozambique
-
 Myanmar
-
 Namibia
-
 Nepal
Nepal
-
 Netherlands
-
 New Zealand
-
 Nigeria
-
 North Macedonia
-
 Norway
-
 Oman
Oman
-
 Pakistan
-
 Palestine
-
 Panama
-
 Papua New Guinea
-
 Paraguay
-
 Peru
Peru
-
 Philippines
-
 Poland
-
 Portugal
-
 Puerto Rico
-
 Qatar
Qatar
-
 Reunion
-
 Romania
-
 Rwanda
-
 Saudi Arabia
-
 Serbia
-
 Singapore
-
 Slovakia
-
 Slovenia
-
 Somalia
-
 South Africa
-
 Spain
Spain
-
 Sri Lanka
-
 Sweden
-
 Switzerland
-
 Syria
Syria
-
 Taiwan
-
 Tajikistan
-
 Tanzania
-
 Thailand
-
 Trinidad and Tobago
-
 Tunisia
-
 Turkey
-
 UAE
UAE
-
 Uganda
-
 Ukraine
-
 United Kingdom
-
United States
-
 Uruguay
-
 Uzbekistan
-
 Venezuela
-
 Vietnam
-
 Yemen
Yemen
-
 Zambia
-
 Zimbabwe
- Forex
- Crypto












