

Will Celestia avoid deeper declines amid strong downward momentum?

Celestia (TIA) is trading at $0.5325, marking a daily decline of 7.63%. The asset currently sits in a zone below its key short- and medium-term moving averages, while maintaining a long-term position above major support indicators.
 0.5336
0.6333
0.5336
0.6333
Highlights
- Derive V3 has completed its integration of Celestia as a data availability layer, confirming new real-world usage for Celestia's blockchain architecture.
- Celestia Fibre recently reported throughput of 3.07 terabits per second, establishing high operational performance and technical credibility.
- TIA/USD trades lower and consolidates under key resistance, with indicators showing seller dominance and an expected range of $0.4882 to $0.5768 for the next 2 to 3 days.
Expanded ecosystem adoption drives visibility despite selling pressure
Derive V3, a blockchain-based options platform, completed its integration of Celestia as its data availability layer, confirming concrete adoption of Celestia’s underlying architecture, according to Interactivecrypto. This ecosystem development increases Celestia’s profile among decentralized platforms by providing practical, real-world usage for its network capabilities. Separately, Celestia Fibre benchmarks reported throughput of 3.07 terabits per second, which demonstrates high operational performance and supports the platform’s technical credibility, according to Interactivecrypto. Both events highlight expanding adoption, though price action has remained under broader selling pressure.
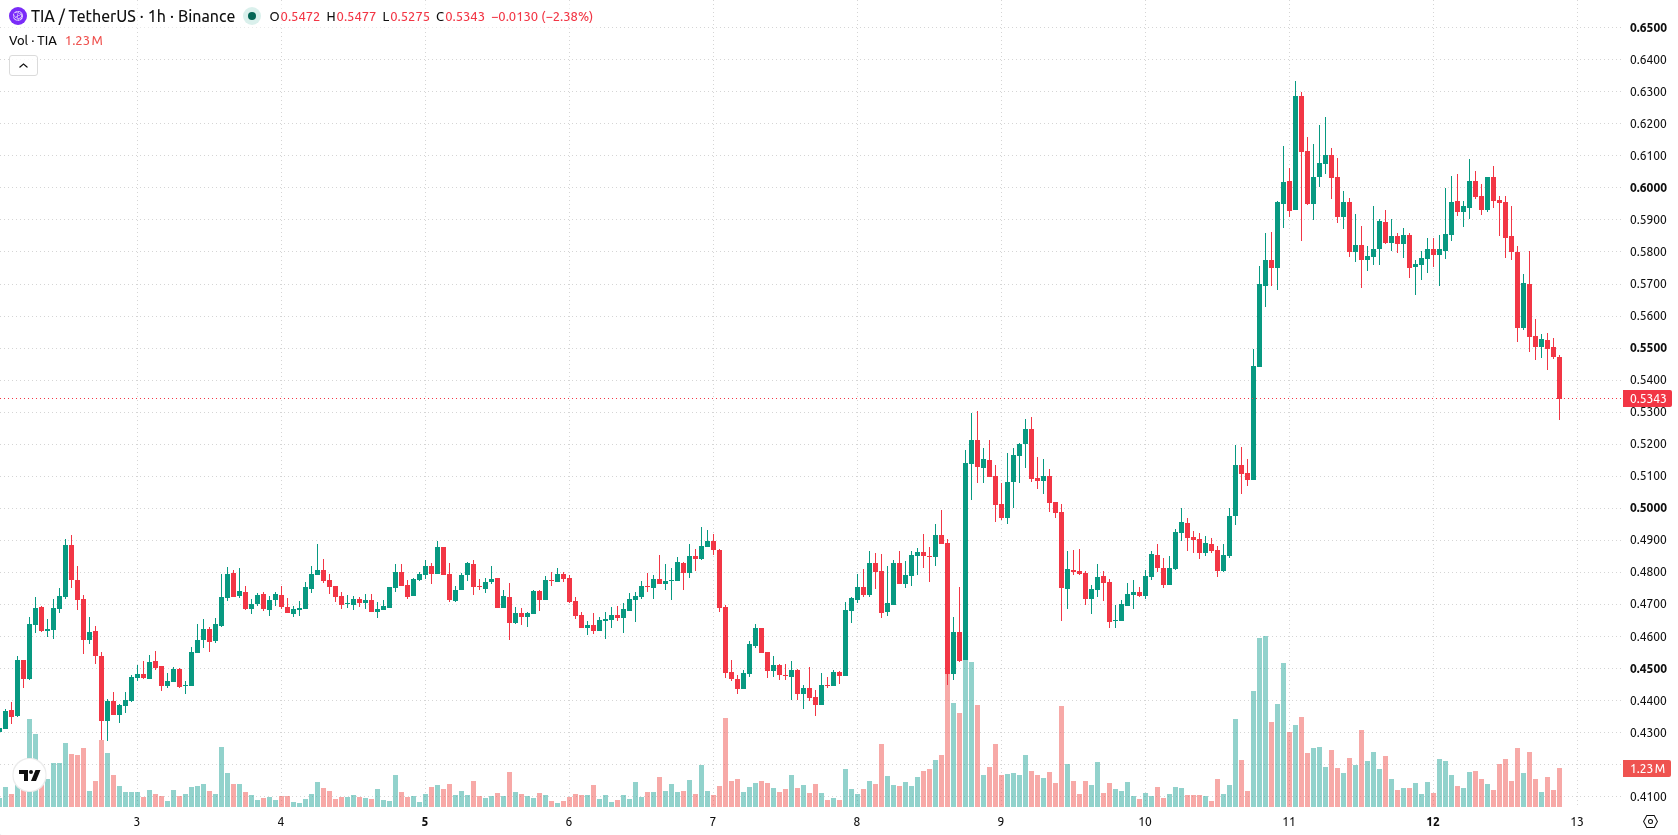
Bearish momentum confirmed as price tests lower trading band
On the technical front, TIA/USD faces immediate resistance at the Ichimoku Kijun on the daily timeframe at $0.5759, with intraday resistance levels at MA-20 ($0.5792) and MA-50 ($0.5851) on the h1 chart. The long-term MA-200 on the daily timeframe at $0.3747 acts as structural support. On the momentum side, MACD and ADX are both signaling Sell, while RSI is at 36 and both Stochastic RSI and CCI remain in oversold territory. Bull/Bear Power and the Awesome Oscillator also confirm seller dominance, with price action aligning closely to the lower end of its daily trading range amid heightened volatility.
Downside risk elevated as volatility sets trading range
Over the next two to three trading days, TIA/USD is likely to oscillate within the $0.4882 to $0.5768 range—consistent with typical volatility for this market phase. The probability of further downside stands at 68%, with a 32% up-move likelihood. Should TIA manage a sustained break above $0.5759, additional short-term upside could develop. In the bearish scenario, persistent selling below $0.4882 would point to accelerated downside momentum.
Earlier, analysts noted that Celestia’s integration with Derive V3 underscored a constructive outlook for the protocol driven by notable ecosystem developments. The current analysis signals a shift in market structure with increased downside risk, making the $0.4882 support level pivotal for short-term traders monitoring further losses or a potential reversal.





Latest Celestia News





-
 Afghanistan
-
 Albania
-
 Algeria
-
 Angola
-
 Argentina
-
 Armenia
-
 Australia
-
 Austria
-
 Azerbaijan
-
 Bahamas
-
 Bahrain
-
 Bangladesh
-
 Belarus
-
 Belgium
-
 Bolivia
-
 Botswana
-
 Brazil
-
 Brunei
-
 Bulgaria
-
 Cambodia
-
 Cameroon
-
 Canada
-
 Chile
Chile
-
 China
China
-
 Colombia
-
 Congo
Congo
-
 Costa Rica
-
 Cote d'Ivoire
-
 Croatia
-
 Cuba
Cuba
-
 Cyprus
-
 Czechia
-
 DR Congo
-
 Denmark
-
 Dominican Republic
-
 Ecuador
-
 Egypt
Egypt
-
 El Salvador
-
 Estonia
-
 Eswatini
-
 Ethiopia
-
 Finland
-
 France
-
 Georgia
-
 Germany
-
 Ghana
Ghana
-
 Greece
-
 Haiti
Haiti
-
 Hong Kong
-
 Hungary
-
 India
India
-
 Indonesia
-
 Iran, Islamic republic
-
 Iraq
Iraq
-
 Ireland
-
 Israel
-
 Italy
Italy
-
 Jamaica
-
 Japan
Japan
-
 Jordan
-
 Kazakhstan
-
 Kenya
Kenya
-
 Korea
Korea
-
 Kuwait
-
 Kyrgyzstan
-
 Laos
Laos
-
 Latvia
-
 Lebanon
-
 Lesotho
-
 Libya
Libya
-
 Lithuania
-
 Luxembourg
-
 Madagascar
-
 Malaysia
-
 Malta
Malta
-
 Mauritius
-
 Mexico
-
 Moldova
-
 Mongolia
-
 Montenegro
-
 Morocco
-
 Mozambique
-
 Myanmar
-
 Namibia
-
 Nepal
Nepal
-
 Netherlands
-
 New Zealand
-
 Nigeria
-
 North Macedonia
-
 Norway
-
 Oman
Oman
-
 Pakistan
-
 Palestine
-
 Panama
-
 Papua New Guinea
-
 Paraguay
-
 Peru
Peru
-
 Philippines
-
 Poland
-
 Portugal
-
 Puerto Rico
-
 Qatar
Qatar
-
 Reunion
-
 Romania
-
 Rwanda
-
 Saudi Arabia
-
 Serbia
-
 Singapore
-
 Slovakia
-
 Slovenia
-
 Somalia
-
 South Africa
-
 Spain
Spain
-
 Sri Lanka
-
 Sweden
-
 Switzerland
-
 Syria
Syria
-
 Taiwan
-
 Tajikistan
-
 Tanzania
-
 Thailand
-
 Trinidad and Tobago
-
 Tunisia
-
 Turkey
-
 UAE
UAE
-
 Uganda
-
 Ukraine
-
 United Kingdom
-
United States
-
 Uruguay
-
 Uzbekistan
-
 Venezuela
-
 Vietnam
-
 Yemen
Yemen
-
 Zambia
-
 Zimbabwe
- Forex
- Crypto












