

MACD and ADX alignment to the downside leaves Celestia vulnerable near key support: weekly forecast

Celestia (TIA) is trading near $0.36 after dropping around 19% over the past week, as sellers dominated the trend and technical conditions deteriorated. Despite recent updates in blockchain throughput, the focus shifts to whether support can stabilize the slide or if sellers could extend the decline into next week.
 0.3629
0.4800
Highlights
- Celestia fell 19.49% over the past week to $0.3555, trading decisively below key moving averages.
- Technical momentum and trend indicators are strongly negative, with very high weekly volatility and oversold readings.
- Price is expected to remain pressured next week in a $0.2844 to $0.4266 range, with support at $0.3278 and resistance at $0.4052.
Scalability milestone achieved as Voyager’s security and mainnet impact questioned
In the past week, Celestia announced that its Voyager blockchain architecture achieved a benchmark of sustaining over 21 million account-to-account transfers per second, according to Blockchain.News. This technical milestone reflects innovation in scalability but was reached with some security features like signature checks still pending, as noted by Blockchain.News and cryptonews.net. While these advances highlight ongoing development, the mainnet integration and real-world performance of Voyager are yet to be fully established.
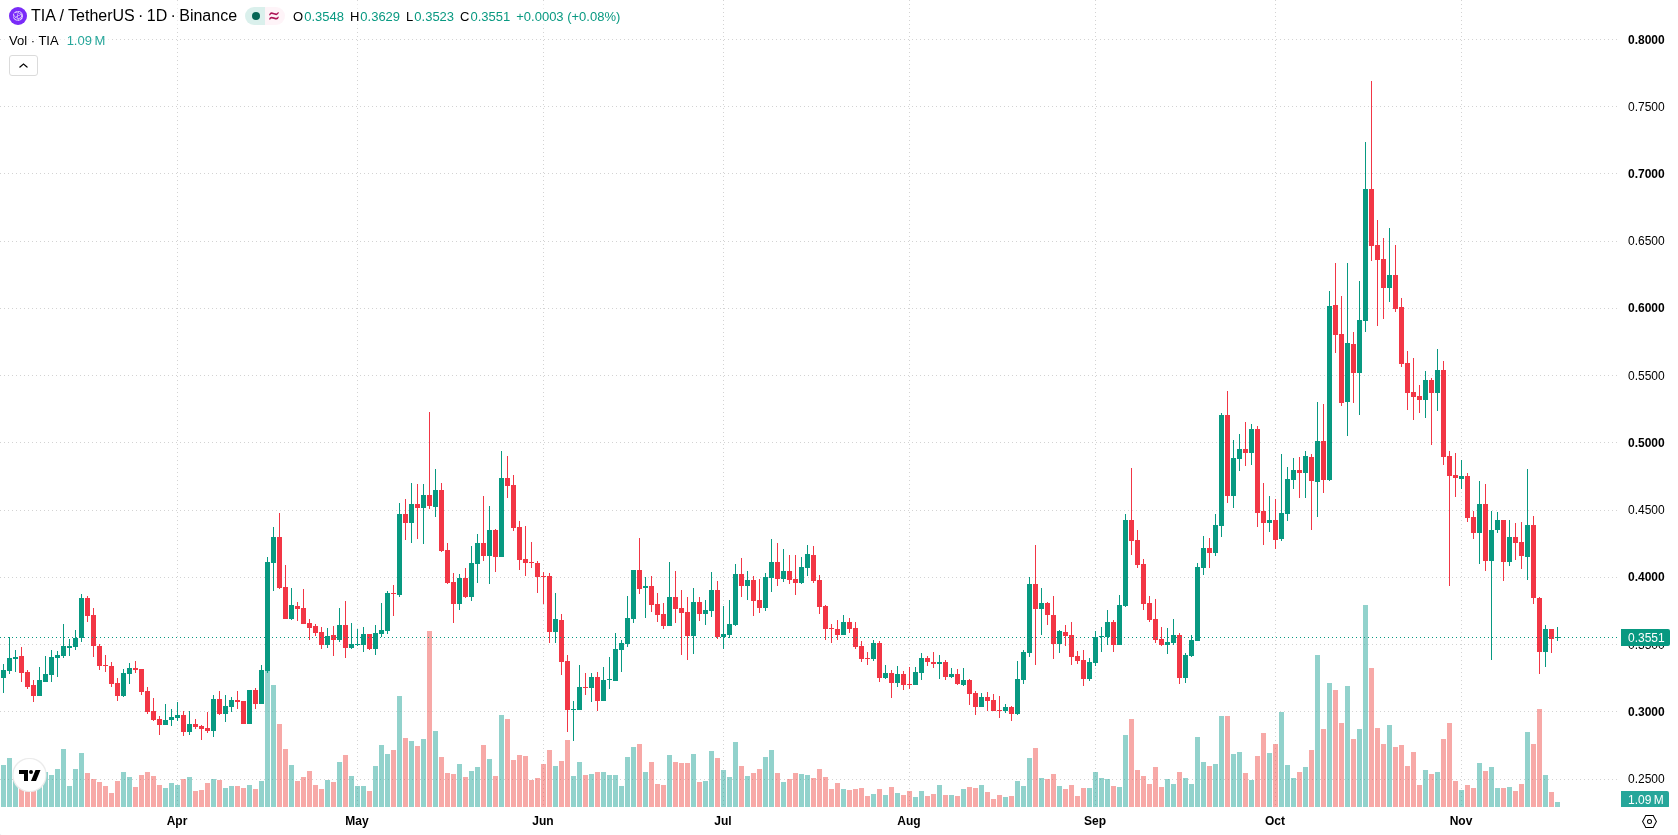
Oversold CCI contrasts with strong downside signals from MACD and ADX this week
The daily chart presents a firmly trending decline, with momentum characterized as a sustained move lower with a firm trend and weekly volatility at 46.43%. CCI is in the oversold zone at -153.2889, which may point to some potential for a rebound but does not outweigh the very strong negative signals from both the MACD and ADX, which are aligned to the downside. Price is sitting near the weekly low and faces initial support at $0.3278, while the nearest resistance is seen at $0.4052.
Further downside favored next week as bears threaten support levels
Next week, Celestia is expected to trade between $0.2844 and $0.4266. There is a very high probability of further downside and a very low probability of a rebound. The base case is for the price to remain pressured and hold within the lower half of the range. A move above $0.4052 would open the door for a more bullish correction, while a break below $0.3278 would imply further weakness toward the lower boundary of the expected range. On the weekly chart the longer-term picture stays firmly negative.
Earlier, analysts noted that Celestia was experiencing persistent bearish momentum despite technological milestones that highlighted its scalability potential. The current outlook reinforces this negative bias, with technical signals indicating that traders should monitor $0.3278 as a critical support level that, if breached, could accelerate downside risk in the coming sessions.










-
 Afghanistan
-
 Albania
-
 Algeria
-
 Angola
-
 Argentina
-
 Armenia
-
 Australia
-
 Austria
-
 Azerbaijan
-
 Bahamas
-
 Bahrain
-
 Bangladesh
-
 Belarus
-
 Belgium
-
 Bolivia
-
 Botswana
-
 Brazil
-
 Brunei
-
 Bulgaria
-
 Cambodia
-
 Cameroon
-
 Canada
-
 Chile
-
 China
-
 Colombia
-
 Congo
-
 Costa Rica
-
 Cote d'Ivoire
-
 Croatia
-
 Cuba
-
 Cyprus
-
 Czechia
-
 DR Congo
-
 Denmark
-
 Dominican Republic
-
 Ecuador
-
 Egypt
-
 El Salvador
-
 Estonia
-
 Eswatini
-
 Ethiopia
-
 Finland
-
 France
-
 Georgia
-
 Germany
-
 Ghana
-
 Greece
-
 Haiti
-
 Hong Kong
-
 Hungary
-
 India
-
 Indonesia
-
 Iran, Islamic republic
-
 Iraq
-
 Ireland
-
 Israel
-
 Italy
-
 Jamaica
-
 Japan
-
 Jordan
-
 Kazakhstan
-
 Kenya
-
 Korea
-
 Kuwait
-
 Kyrgyzstan
-
 Laos
-
 Latvia
-
 Lebanon
-
 Lesotho
-
 Libya
-
 Lithuania
-
 Luxembourg
-
 Madagascar
-
 Malaysia
-
 Malta
-
 Mauritius
-
 Mexico
-
 Moldova
-
 Mongolia
-
 Montenegro
-
 Morocco
-
 Mozambique
-
 Myanmar
-
 Namibia
-
 Nepal
-
 Netherlands
-
 New Zealand
-
 Nigeria
-
 North Macedonia
-
 Norway
-
 Oman
-
 Pakistan
-
 Palestine
-
 Panama
-
 Papua New Guinea
-
 Paraguay
-
 Peru
-
 Philippines
-
 Poland
-
 Portugal
-
 Puerto Rico
-
 Qatar
-
 Reunion
-
 Romania
-
 Rwanda
-
 Saudi Arabia
-
 Serbia
-
 Singapore
-
 Slovakia
-
 Slovenia
-
 Somalia
-
 South Africa
-
 Spain
-
 Sri Lanka
-
 Sweden
-
 Switzerland
-
 Syria
-
 Taiwan
-
 Tajikistan
-
 Tanzania
-
 Thailand
-
 Trinidad and Tobago
-
 Tunisia
-
 Turkey
-
 UAE
-
 Uganda
-
 Ukraine
-
 United Kingdom
-
United States
-
 Uruguay
-
 Uzbekistan
-
 Venezuela
-
 Vietnam
-
 Yemen
-
 Zambia
-
 Zimbabwe
- Forex
- Crypto












