

Sei declines amid sustained selling pressure and lack of strong buying interest

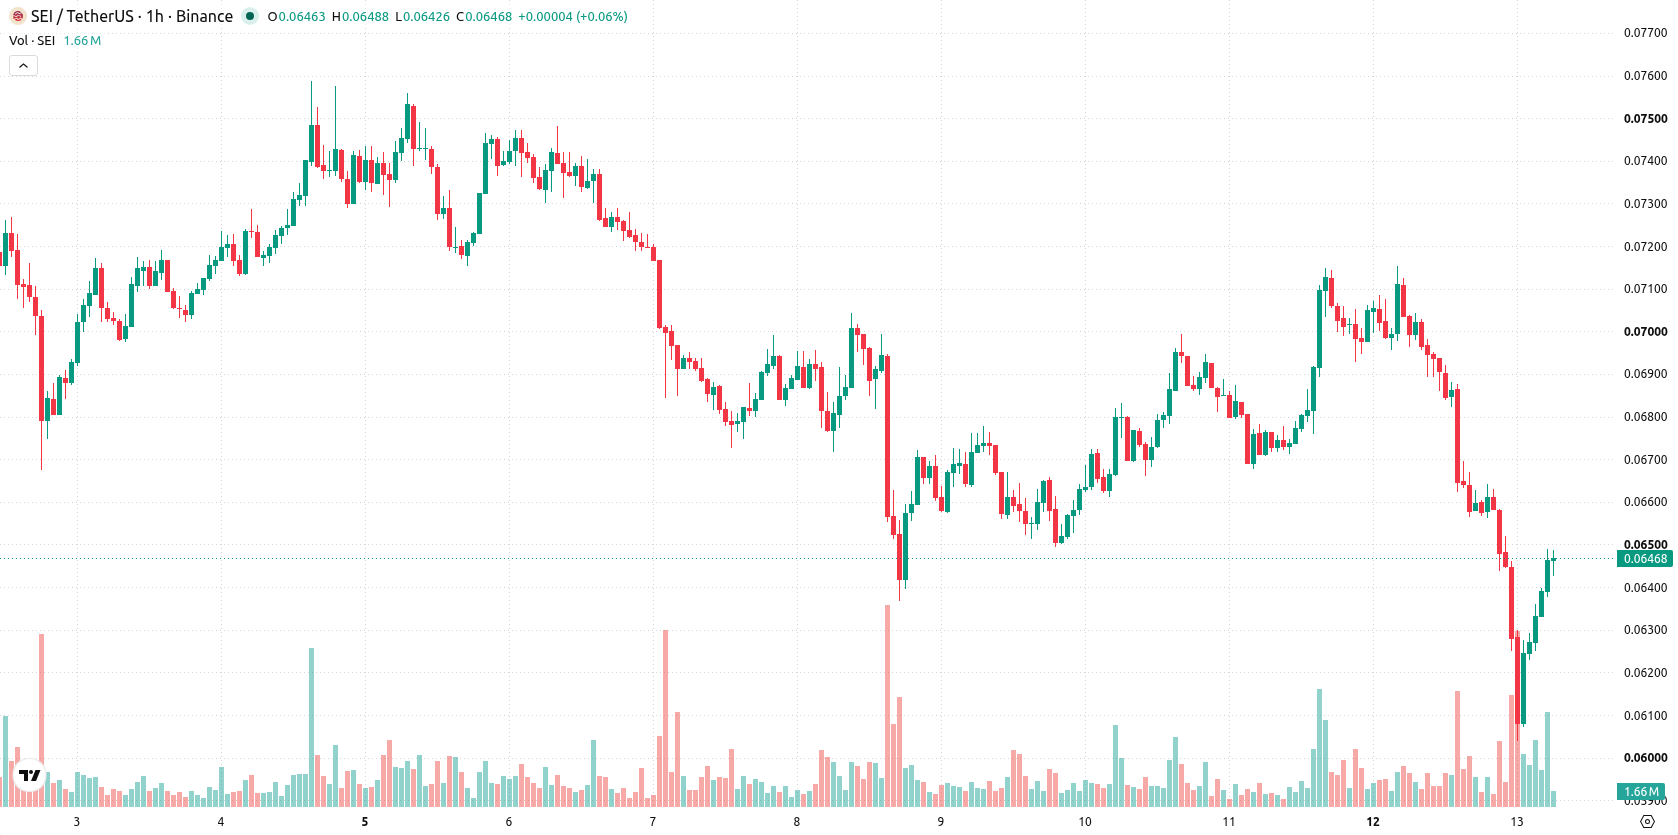
Sei (SEI) is trading at $0.0647, down 7.12% on the day. The price sits below its key moving averages for the short and medium term, while remaining above the long-term mark.
 0.0649
0.0721
0.0649
0.0721
Highlights
- SEI/USD trades below key short- and medium-term moving averages, signaling persistent selling pressure and near-term weakness.
- Price faces immediate resistance at $0.066, with sellers dominating intraday trade and downside risk prevailing.
- The expected trading range for the next 2 to 3 days is $0.0601 to $0.0668 with a 70% probability of further declines.
Bearish momentum maintained as multiple indicators confirm downside strength
SEI/USD is trading below both its MA-20 ($0.0654) and MA-50 ($0.0677) on the 1-hour chart, with the MA-200 on the daily timeframe offering longer-term support at $0.054. Immediate resistance is defined by the Ichimoku Kijun level at $0.066. Momentum signals reflect prevailing selling pressure, as MACD (Strong Sell) and ADX (Sell) are both negative. RSI is at 40.84, indicating limited selling exhaustion, while CCI is neutral. Stoch RSI readings suggest an overbought setup despite the dominant downside move. Bull/Bear Power also points to intraday seller dominance.
Downside risk elevated as consolidation range narrows
Over the next 2 to 3 trading days, SEI/USD is expected to trade within the $0.0601–$0.0668 range. There is a 70% probability of the price moving lower, with only a 30% chance of recovery. Baseline expectations suggest consolidation between support and resistance; a break above $0.066 may prompt an upside attempt, while falling below $0.0601 could lead to further declines.
Earlier, analysts noted that Sei remained under sustained technical pressure, with downside risks dominating the short-term outlook. The current analysis reinforces this view, indicating that prevailing momentum favors sellers and puts heightened focus on the $0.0601 level as a critical support to monitor for further downside risk in the coming days.










-
 Afghanistan
-
 Albania
-
 Algeria
-
 Angola
-
 Argentina
-
 Armenia
-
 Australia
-
 Austria
-
 Azerbaijan
-
 Bahamas
-
 Bahrain
-
 Bangladesh
-
 Belarus
-
 Belgium
-
 Bolivia
-
 Botswana
-
 Brazil
-
 Brunei
-
 Bulgaria
-
 Cambodia
-
 Cameroon
-
 Canada
-
 Chile
Chile
-
 China
China
-
 Colombia
-
 Congo
Congo
-
 Costa Rica
-
 Cote d'Ivoire
-
 Croatia
-
 Cuba
Cuba
-
 Cyprus
-
 Czechia
-
 DR Congo
-
 Denmark
-
 Dominican Republic
-
 Ecuador
-
 Egypt
Egypt
-
 El Salvador
-
 Estonia
-
 Eswatini
-
 Ethiopia
-
 Finland
-
 France
-
 Georgia
-
 Germany
-
 Ghana
Ghana
-
 Greece
-
 Haiti
Haiti
-
 Hong Kong
-
 Hungary
-
 India
India
-
 Indonesia
-
 Iran, Islamic republic
-
 Iraq
Iraq
-
 Ireland
-
 Israel
-
 Italy
Italy
-
 Jamaica
-
 Japan
Japan
-
 Jordan
-
 Kazakhstan
-
 Kenya
Kenya
-
 Korea
Korea
-
 Kuwait
-
 Kyrgyzstan
-
 Laos
Laos
-
 Latvia
-
 Lebanon
-
 Lesotho
-
 Libya
Libya
-
 Lithuania
-
 Luxembourg
-
 Madagascar
-
 Malaysia
-
 Malta
Malta
-
 Mauritius
-
 Mexico
-
 Moldova
-
 Mongolia
-
 Montenegro
-
 Morocco
-
 Mozambique
-
 Myanmar
-
 Namibia
-
 Nepal
Nepal
-
 Netherlands
-
 New Zealand
-
 Nigeria
-
 North Macedonia
-
 Norway
-
 Oman
Oman
-
 Pakistan
-
 Palestine
-
 Panama
-
 Papua New Guinea
-
 Paraguay
-
 Peru
Peru
-
 Philippines
-
 Poland
-
 Portugal
-
 Puerto Rico
-
 Qatar
Qatar
-
 Reunion
-
 Romania
-
 Rwanda
-
 Saudi Arabia
-
 Serbia
-
 Singapore
-
 Slovakia
-
 Slovenia
-
 Somalia
-
 South Africa
-
 Spain
Spain
-
 Sri Lanka
-
 Sweden
-
 Switzerland
-
 Syria
Syria
-
 Taiwan
-
 Tajikistan
-
 Tanzania
-
 Thailand
-
 Trinidad and Tobago
-
 Tunisia
-
 Turkey
-
 UAE
UAE
-
 Uganda
-
 Ukraine
-
 United Kingdom
-
United States
-
 Uruguay
-
 Uzbekistan
-
 Venezuela
-
 Vietnam
-
 Yemen
Yemen
-
 Zambia
-
 Zimbabwe
- Forex
- Crypto












