

Sei drops almost 11% after reversal leaves asset below near-term moving average

Sei (SEI) fell 10.73% as selling pressure dominated following an intraday downside reversal that left the asset below the near-term MA-20 and up against technical resistance. The move is supported by persistent bearish momentum and a price structure vulnerable to further downside, with only the medium- and long-term moving averages providing potential limits beneath current levels.
 0.063
0.0721
0.063
0.0721
Highlights
- SEI/USD is trading below its short-term moving average, showing seller pressure offset by a bullish medium-term structure.
- Technical indicators deliver mixed momentum signals, with MACD and ADX pointing to underlying strength and oscillators mostly neutral.
- Over the next 5 trading days, SEI/USD is projected to consolidate in the $0.0557 to $0.0683 range, with over 80% probability of an upward move.
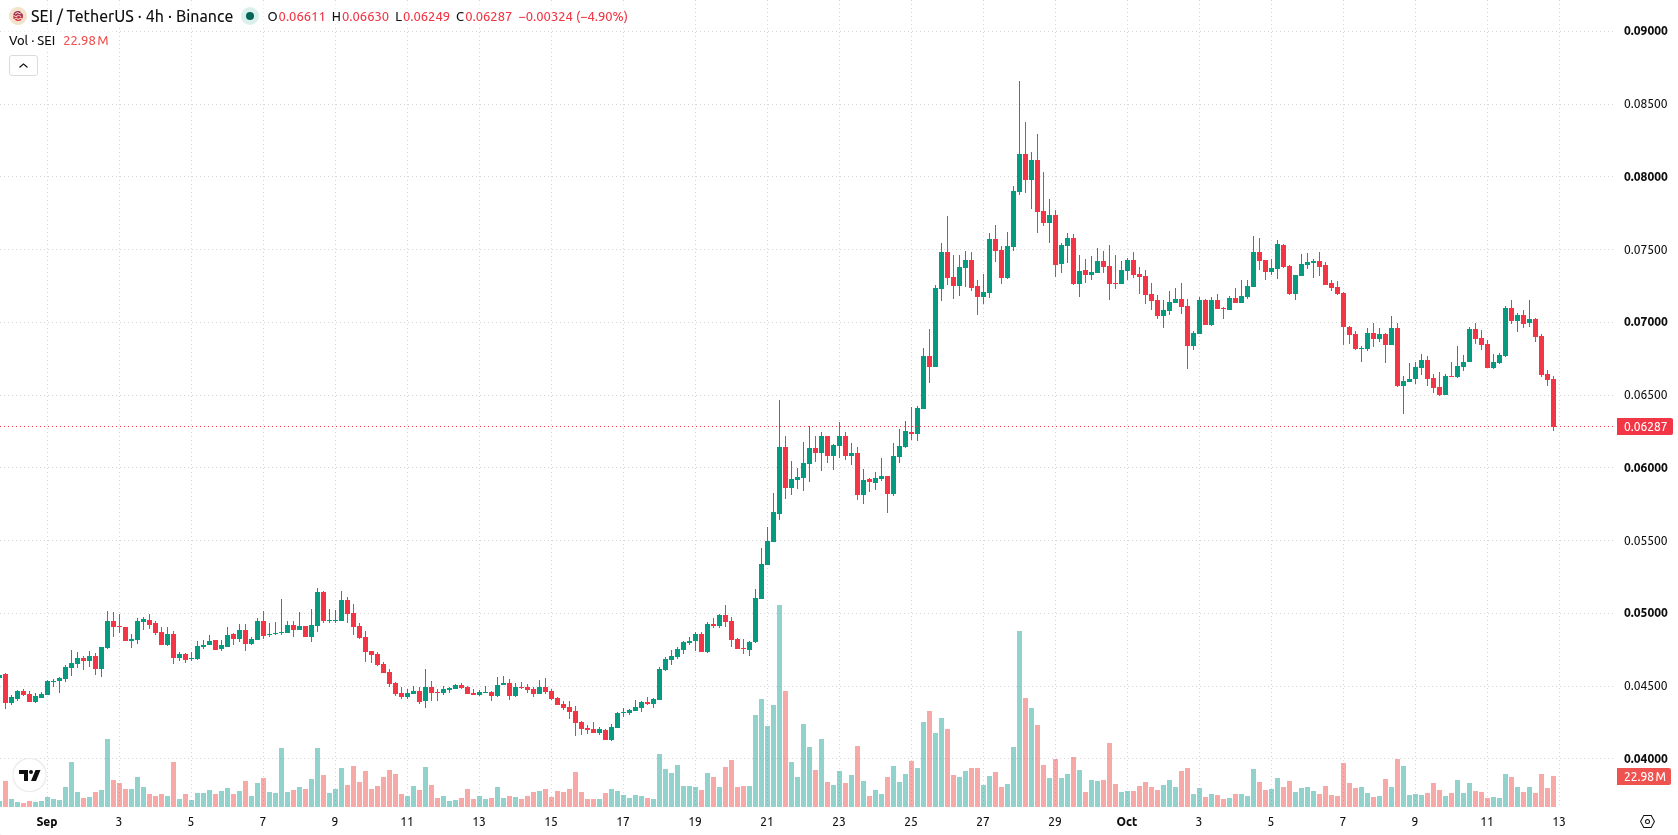
Sustained seller pressure as technical signals present mixed momentum
SEI/USD is trading below the MA-20 ($0.0702) but remains above the MA-50 ($0.0563) and MA-200 ($0.0539), reflecting near-term pressure from sellers alongside a medium- and long-term bullish alignment. The closest technical levels are resistance at the near_term_ceiling of $0.0637 and support at the near_term_floor of $0.0563, with the Ichimoku Kijun ($0.0639) acting as resistance above the price. Momentum indicators show a mixed picture: MACD and ADX suggest strong, bullish underlying momentum, while RSI at 58.62 remains in the buy zone. Stochastic RSI and CCI are neutral, and BBP at 0.0025 indicates buyers dominate intraday, even as the Awesome Oscillator reads neutral. Intraday volatility reached 8.99%, and price is near its daily low, highlighting the current bearish tone.
Earlier, analysts noted that Sei remained under sustained technical pressure, with downside risks dominating the short-term outlook. The current setup introduces a more nuanced view, highlighting mixed momentum indicators and suggesting traders monitor the $0.0683 resistance and $0.0557 support as key pivots for potential breakout or breakdown scenarios in the days ahead.










-
 Afghanistan
-
 Albania
-
 Algeria
-
 Angola
-
 Argentina
-
 Armenia
-
 Australia
-
 Austria
-
 Azerbaijan
-
 Bahamas
-
 Bahrain
-
 Bangladesh
-
 Belarus
-
 Belgium
-
 Bolivia
-
 Botswana
-
 Brazil
-
 Brunei
-
 Bulgaria
-
 Cambodia
-
 Cameroon
-
 Canada
-
 Chile
Chile
-
 China
China
-
 Colombia
-
 Congo
Congo
-
 Costa Rica
-
 Cote d'Ivoire
-
 Croatia
-
 Cuba
Cuba
-
 Cyprus
-
 Czechia
-
 DR Congo
-
 Denmark
-
 Dominican Republic
-
 Ecuador
-
 Egypt
Egypt
-
 El Salvador
-
 Estonia
-
 Eswatini
-
 Ethiopia
-
 Finland
-
 France
-
 Georgia
-
 Germany
-
 Ghana
Ghana
-
 Greece
-
 Haiti
Haiti
-
 Hong Kong
-
 Hungary
-
 India
India
-
 Indonesia
-
 Iran, Islamic republic
-
 Iraq
Iraq
-
 Ireland
-
 Israel
-
 Italy
Italy
-
 Jamaica
-
 Japan
Japan
-
 Jordan
-
 Kazakhstan
-
 Kenya
Kenya
-
 Korea
Korea
-
 Kuwait
-
 Kyrgyzstan
-
 Laos
Laos
-
 Latvia
-
 Lebanon
-
 Lesotho
-
 Libya
Libya
-
 Lithuania
-
 Luxembourg
-
 Madagascar
-
 Malaysia
-
 Malta
Malta
-
 Mauritius
-
 Mexico
-
 Moldova
-
 Mongolia
-
 Montenegro
-
 Morocco
-
 Mozambique
-
 Myanmar
-
 Namibia
-
 Nepal
Nepal
-
 Netherlands
-
 New Zealand
-
 Nigeria
-
 North Macedonia
-
 Norway
-
 Oman
Oman
-
 Pakistan
-
 Palestine
-
 Panama
-
 Papua New Guinea
-
 Paraguay
-
 Peru
Peru
-
 Philippines
-
 Poland
-
 Portugal
-
 Puerto Rico
-
 Qatar
Qatar
-
 Reunion
-
 Romania
-
 Rwanda
-
 Saudi Arabia
-
 Serbia
-
 Singapore
-
 Slovakia
-
 Slovenia
-
 Somalia
-
 South Africa
-
 Spain
Spain
-
 Sri Lanka
-
 Sweden
-
 Switzerland
-
 Syria
Syria
-
 Taiwan
-
 Tajikistan
-
 Tanzania
-
 Thailand
-
 Trinidad and Tobago
-
 Tunisia
-
 Turkey
-
 UAE
UAE
-
 Uganda
-
 Ukraine
-
 United Kingdom
-
United States
-
 Uruguay
-
 Uzbekistan
-
 Venezuela
-
 Vietnam
-
 Yemen
Yemen
-
 Zambia
-
 Zimbabwe
- Forex
- Crypto












