

Sei extends downward move as sellers maintain control despite oversold signals

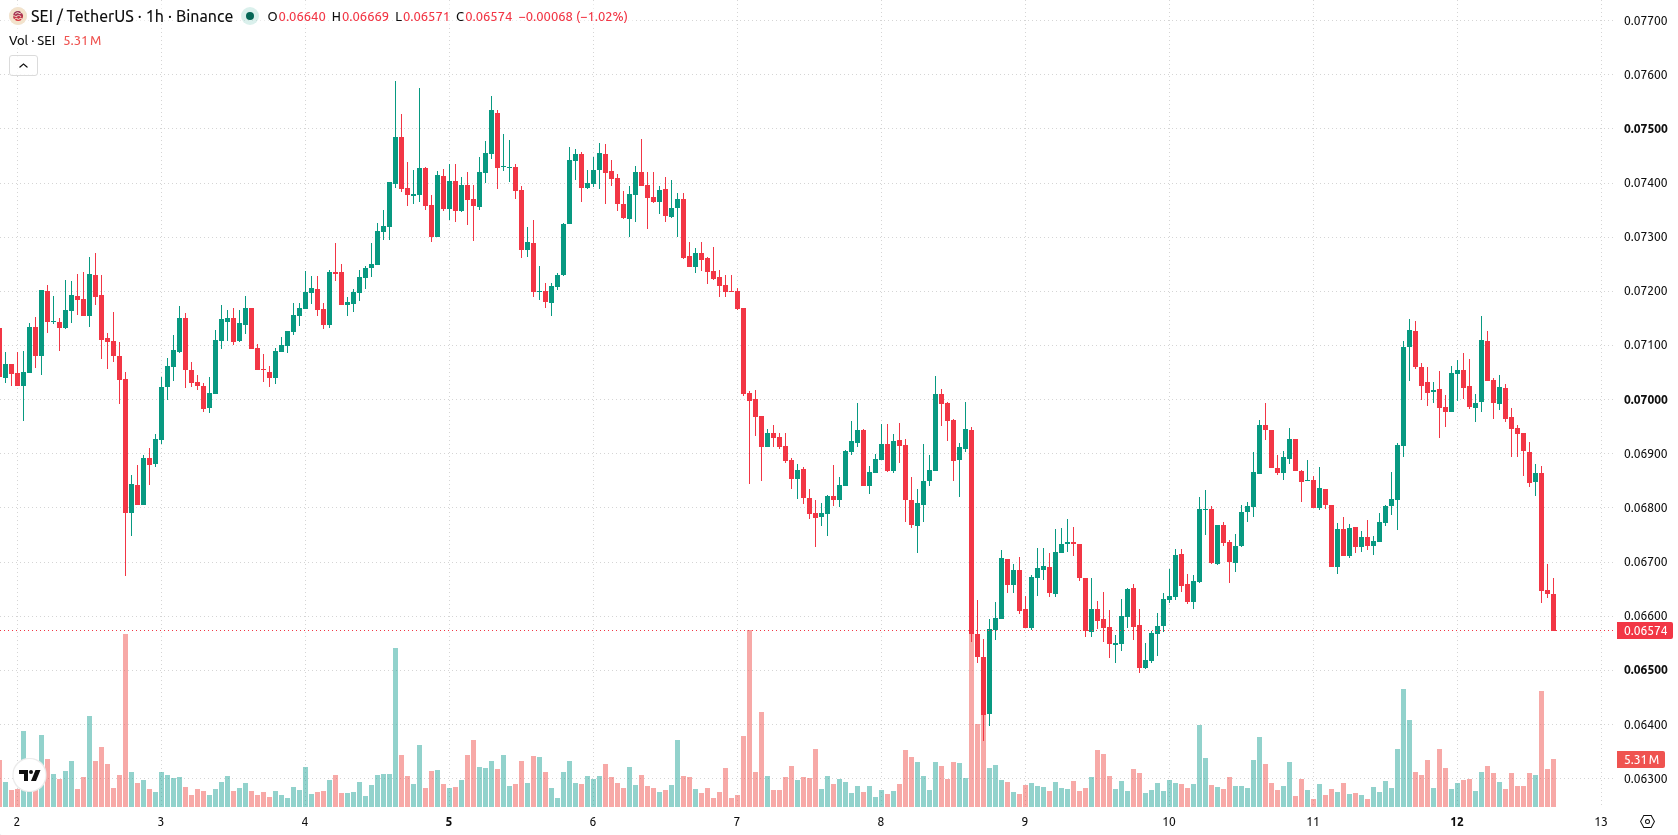
Sei (SEI) is trading at $0.0658, down 7.9% on the day and holding near session lows. The asset remains below its key moving averages in the short and medium term, while retaining long-term support.
 0.0715
0.0748
0.0715
0.0748
Highlights
- SEI trades below short- and medium-term moving averages, confirming sustained selling pressure and a bearish intraday structure.
- Momentum and oscillator indicators collectively show bearish signals and oversold conditions, with no clear bullish divergence present.
- SEI fell 7.9% to $0.0658 and is expected to range between $0.0633 and $0.0683 over the next two to three days, with a very high probability of further downside unless price decisively clears $0.0689 resistance.
Oversold signals and bearish momentum intensify near resistance
On the hourly chart, SEI/USD is trading below both the MA-20 ($0.0695) and MA-50 ($0.069), with price action remaining above the MA-200 ($0.0539) on the daily timeframe. The Ichimoku Kijun at $0.0689 now acts as immediate resistance on rebounds. Momentum indicators signal weakness: MACD remains bearish, ADX is neutral, and multiple oscillators confirm oversold conditions—RSI at 32 (Sell), Stoch RSI, and CCI all in oversold territory, while Bull/Bear Power continues to reflect strong seller dominance. The Awesome Oscillator is also aligned with the ongoing downtrend, and intraday price action is characterized by persistent volatility, with no divergence detected.
Further downside risks amplified as volatility drives trading range
In the short term, SEI is expected to remain volatile within a range of $0.0633 to $0.0683 over the next two to three trading days. The probability of an upside breakout is very low, while a further decline below support at $0.0633 has a very high probability if selling intensifies. The base case sees SEI stabilizing within this range, with a bullish scenario only possible upon a decisive close above resistance at $0.0689.
Earlier, analysts noted that Sei was experiencing persistent technical weakness and remained under pressure amid a broader range-bound outlook. The latest analysis strengthens this view with fresh downside confirmation, highlighting $0.0633 as a critical support level for traders to monitor in the event of continued selling.





Latest Sei News





-
 Afghanistan
-
 Albania
-
 Algeria
-
 Angola
-
 Argentina
-
 Armenia
-
 Australia
-
 Austria
-
 Azerbaijan
-
 Bahamas
-
 Bahrain
-
 Bangladesh
-
 Belarus
-
 Belgium
-
 Bolivia
-
 Botswana
-
 Brazil
-
 Brunei
-
 Bulgaria
-
 Cambodia
-
 Cameroon
-
 Canada
-
 Chile
Chile
-
 China
China
-
 Colombia
-
 Congo
Congo
-
 Costa Rica
-
 Cote d'Ivoire
-
 Croatia
-
 Cuba
Cuba
-
 Cyprus
-
 Czechia
-
 DR Congo
-
 Denmark
-
 Dominican Republic
-
 Ecuador
-
 Egypt
Egypt
-
 El Salvador
-
 Estonia
-
 Eswatini
-
 Ethiopia
-
 Finland
-
 France
-
 Georgia
-
 Germany
-
 Ghana
Ghana
-
 Greece
-
 Haiti
Haiti
-
 Hong Kong
-
 Hungary
-
 India
India
-
 Indonesia
-
 Iran, Islamic republic
-
 Iraq
Iraq
-
 Ireland
-
 Israel
-
 Italy
Italy
-
 Jamaica
-
 Japan
Japan
-
 Jordan
-
 Kazakhstan
-
 Kenya
Kenya
-
 Korea
Korea
-
 Kuwait
-
 Kyrgyzstan
-
 Laos
Laos
-
 Latvia
-
 Lebanon
-
 Lesotho
-
 Libya
Libya
-
 Lithuania
-
 Luxembourg
-
 Madagascar
-
 Malaysia
-
 Malta
Malta
-
 Mauritius
-
 Mexico
-
 Moldova
-
 Mongolia
-
 Montenegro
-
 Morocco
-
 Mozambique
-
 Myanmar
-
 Namibia
-
 Nepal
Nepal
-
 Netherlands
-
 New Zealand
-
 Nigeria
-
 North Macedonia
-
 Norway
-
 Oman
Oman
-
 Pakistan
-
 Palestine
-
 Panama
-
 Papua New Guinea
-
 Paraguay
-
 Peru
Peru
-
 Philippines
-
 Poland
-
 Portugal
-
 Puerto Rico
-
 Qatar
Qatar
-
 Reunion
-
 Romania
-
 Rwanda
-
 Saudi Arabia
-
 Serbia
-
 Singapore
-
 Slovakia
-
 Slovenia
-
 Somalia
-
 South Africa
-
 Spain
Spain
-
 Sri Lanka
-
 Sweden
-
 Switzerland
-
 Syria
Syria
-
 Taiwan
-
 Tajikistan
-
 Tanzania
-
 Thailand
-
 Trinidad and Tobago
-
 Tunisia
-
 Turkey
-
 UAE
UAE
-
 Uganda
-
 Ukraine
-
 United Kingdom
-
United States
-
 Uruguay
-
 Uzbekistan
-
 Venezuela
-
 Vietnam
-
 Yemen
Yemen
-
 Zambia
-
 Zimbabwe
- Forex
- Crypto












