

Muted price action for Bitcoin as $82,692 support comes into view

Bitcoin (BTC) is trading at $83,874 after a modest daily dip, with the price remaining positioned above its key moving averages.
 84168
85598.22
84168
85598.22
Highlights
- U.S. spot Bitcoin ETFs saw their largest weekly outflows since June, reducing institutional exposure in the asset class.
- Large ETF redemptions have created temporary pressure on spot liquidity, limiting additional buying in the near term.
- BTC/USD is projected to trade between $79,123 to $86,201 over the next four days as bearish momentum indicators persist despite a bullish price structure.
ETF outflows drive cautious sentiment amid dwindling institutional flows
Bitcoin experienced its largest weekly outflows from U.S. spot Bitcoin ETFs since June, reducing large-scale institutional exposure and reflecting more cautious sentiment among professional investors, according to Finance Biggo. Such ETF redemptions can create transient pressure on spot liquidity, potentially limiting further buying in the near term. The event has set the narrative for recent flows, even as the broader news cycle is otherwise lacking in direct market catalysts.
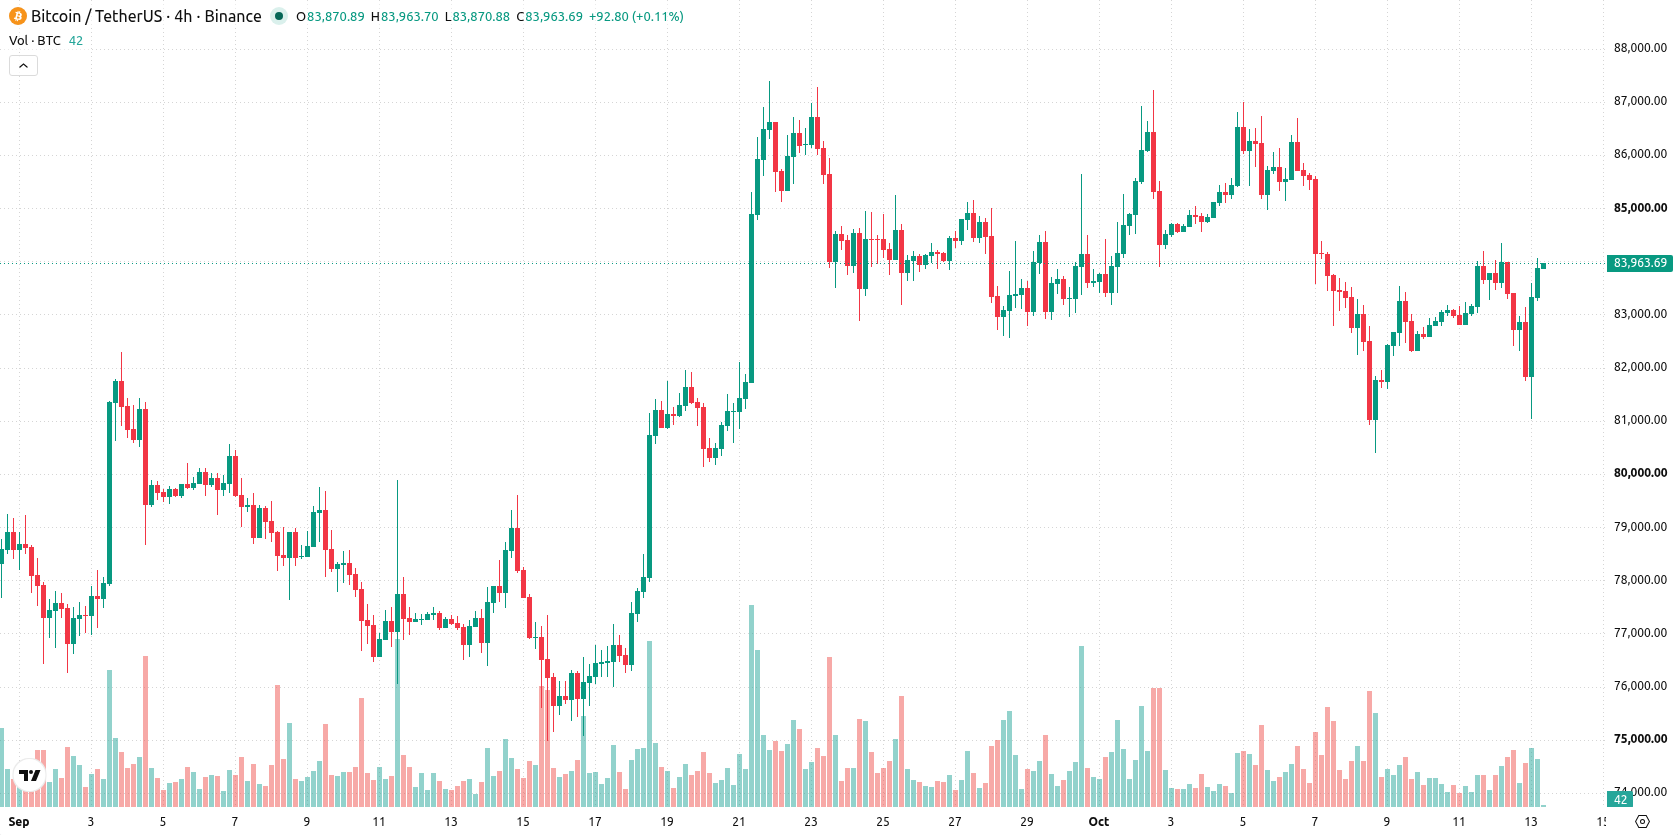
Bearish momentum intensifies as oversold signals and volatility diverge
BTC/USD is trading above the MA-20 and MA-50 on the H4 chart, and remains well above the long-term MA-200. The Ichimoku Kijun level at $82,692 serves as immediate support. On the momentum front, both MACD and Awesome Oscillator signal sell, while ADX is neutral. Bull/Bear Power indicates strong seller dominance intraday. RSI, Stochastic RSI, and CCI all reflect oversold or strong sell conditions, highlighting a divergence as price closes near its daily high amid high intraday volatility and a notable gap of 2,049.
Stabilization favored within trading range as breakout risk rises
Over the next four trading days, BTC/USD is expected to remain within a typical volatility band defined by $79,123 to $86,201. Probabilities favor price stabilizing within this range, with a 57% chance of an upward breakout and a 43% risk of decline. An upside scenario would require a confirmed move above $86,201, while a break below $79,123 would suggest the start of a more meaningful short-term retracement.
Earlier, analysts noted that Bitcoin’s medium-term technical support remained intact despite mixed institutional flows and signals of overbought conditions. The current analysis adds dimension by highlighting an abrupt shift to significant ETF outflows and emerging oversold momentum signals, making $79,123 and $86,201 the key levels for traders to watch for a potential breakout or breakdown in the coming sessions.











-
 Afghanistan
-
 Albania
-
 Algeria
-
 Angola
-
 Argentina
-
 Armenia
-
 Australia
-
 Austria
-
 Azerbaijan
-
 Bahamas
-
 Bahrain
-
 Bangladesh
-
 Belarus
-
 Belgium
-
 Bolivia
-
 Botswana
-
 Brazil
-
 Brunei
-
 Bulgaria
-
 Cambodia
-
 Cameroon
-
 Canada
-
 Chile
Chile
-
 China
China
-
 Colombia
-
 Congo
Congo
-
 Costa Rica
-
 Cote d'Ivoire
-
 Croatia
-
 Cuba
Cuba
-
 Cyprus
-
 Czechia
-
 DR Congo
-
 Denmark
-
 Dominican Republic
-
 Ecuador
-
 Egypt
Egypt
-
 El Salvador
-
 Estonia
-
 Eswatini
-
 Ethiopia
-
 Finland
-
 France
-
 Georgia
-
 Germany
-
 Ghana
Ghana
-
 Greece
-
 Haiti
Haiti
-
 Hong Kong
-
 Hungary
-
 India
India
-
 Indonesia
-
 Iran, Islamic republic
-
 Iraq
Iraq
-
 Ireland
-
 Israel
-
 Italy
Italy
-
 Jamaica
-
 Japan
Japan
-
 Jordan
-
 Kazakhstan
-
 Kenya
Kenya
-
 Korea
Korea
-
 Kuwait
-
 Kyrgyzstan
-
 Laos
Laos
-
 Latvia
-
 Lebanon
-
 Lesotho
-
 Libya
Libya
-
 Lithuania
-
 Luxembourg
-
 Madagascar
-
 Malaysia
-
 Malta
Malta
-
 Mauritius
-
 Mexico
-
 Moldova
-
 Mongolia
-
 Montenegro
-
 Morocco
-
 Mozambique
-
 Myanmar
-
 Namibia
-
 Nepal
Nepal
-
 Netherlands
-
 New Zealand
-
 Nigeria
-
 North Macedonia
-
 Norway
-
 Oman
Oman
-
 Pakistan
-
 Palestine
-
 Panama
-
 Papua New Guinea
-
 Paraguay
-
 Peru
Peru
-
 Philippines
-
 Poland
-
 Portugal
-
 Puerto Rico
-
 Qatar
Qatar
-
 Reunion
-
 Romania
-
 Rwanda
-
 Saudi Arabia
-
 Serbia
-
 Singapore
-
 Slovakia
-
 Slovenia
-
 Somalia
-
 South Africa
-
 Spain
Spain
-
 Sri Lanka
-
 Sweden
-
 Switzerland
-
 Syria
Syria
-
 Taiwan
-
 Tajikistan
-
 Tanzania
-
 Thailand
-
 Trinidad and Tobago
-
 Tunisia
-
 Turkey
-
 UAE
UAE
-
 Uganda
-
 Ukraine
-
 United Kingdom
-
United States
-
 Uruguay
-
 Uzbekistan
-
 Venezuela
-
 Vietnam
-
 Yemen
Yemen
-
 Zambia
-
 Zimbabwe
- Forex
- Crypto












