

Curve DEX vulnerability assessment raises risk: Can CRV avoid further losses?

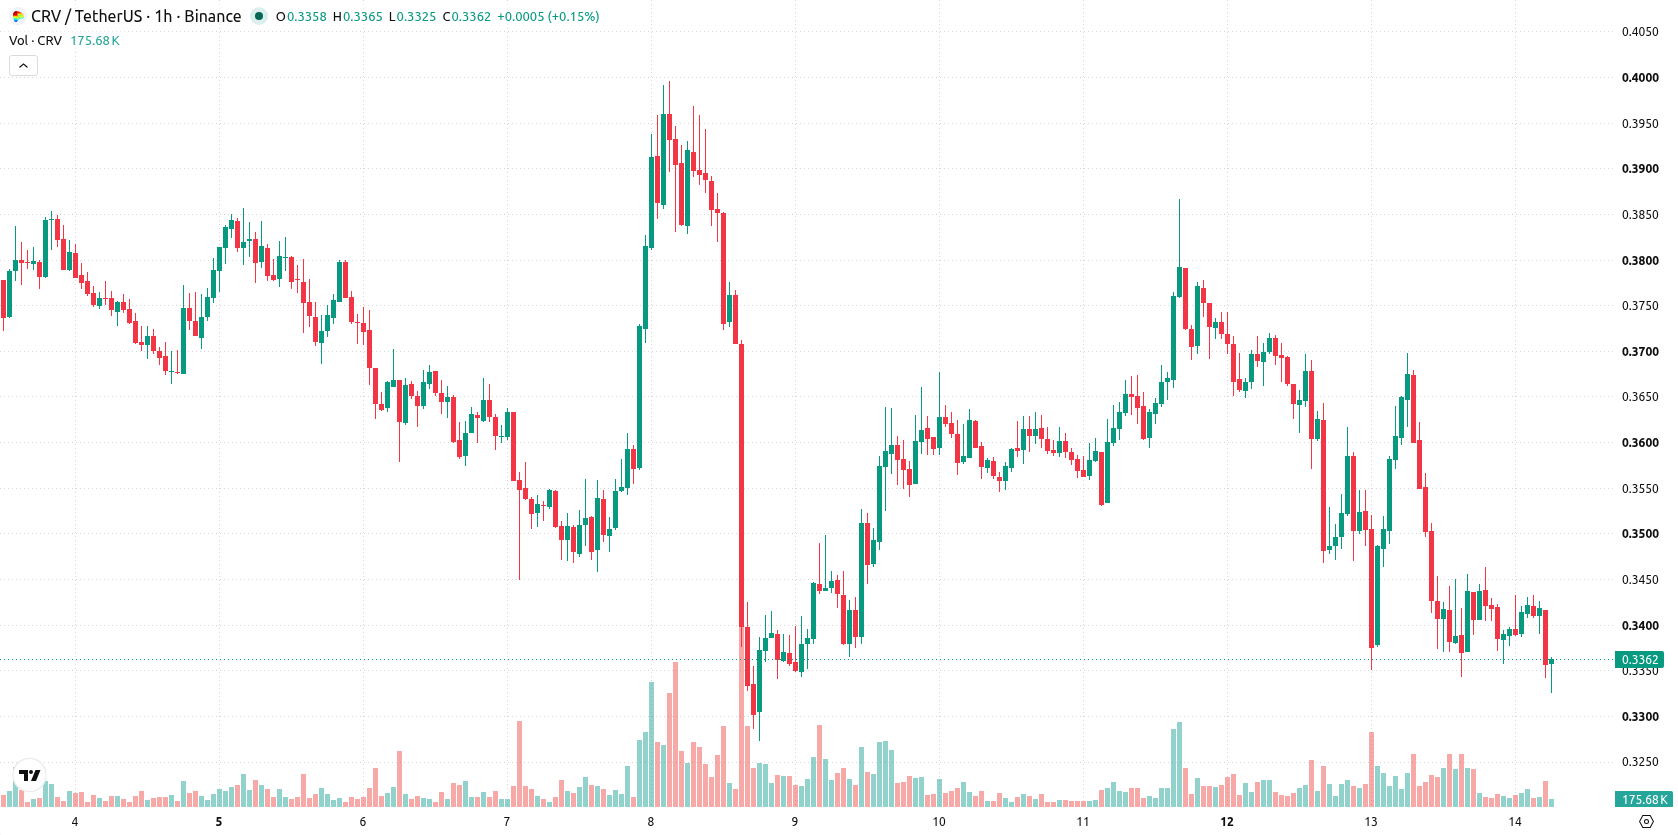
Curve (CRV) is trading at $0.3357 following a daily decline of 7.67%. The price has continued lower today, holding below its short- and medium-term moving averages while remaining above its long-term average.
 0.3432
0.3996
0.3432
0.3996
Highlights
- Curve DEX's cross-chain bridge has been rated high-risk with a score of 7.4 out of 10 due to centralized relayer control and governance vulnerabilities.
- Security concerns over potential asset outflows have increased the perceived risk for liquidity providers across Curve's ecosystem.
- CRV/USD trades below key moving averages, with technical indicators showing strong selling pressure and an expected range of $0.3195 to $0.3553 in the next 2 to 3 days.
Security risks at Curve DEX drive liquidity concerns and sentiment shift
A recent risk assessment has identified Curve DEX's cross-chain bridge as having a high-risk profile at 7.4 out of 10, with principal vulnerabilities linked to centralized relayer control and governance mechanisms that, if left unmitigated, could allow significant asset outflows. Such findings raise concerns among market participants regarding the security of funds locked in Curve's protocols, increasing the perceived risk for current and potential liquidity providers. In the current environment, this assessment has weighed on market sentiment and contributed to nervousness among users across the ecosystem.
Technical barriers reinforce bearish momentum amid neutral oscillators
On the hourly chart, CRV is trading below the MA-20 at $0.3406 and MA-50 at $0.3516, suggesting weakness in both the near-term and medium-term trend. The price continues to hold above the daily MA-200 level of $0.2569. The Ichimoku Kijun line at $0.352 forms a key resistance zone. Momentum signals remain weak, with MACD and Stoch RSI both registering strong sell signals. The RSI stands at 41, leaning negative but not at oversold territory, and CCI also points to a sell. ADX is neutral, while Bull/Bear Power shows some buyer presence in an otherwise subdued intraday tape. Awesome Oscillator is also neutral, reflecting the lack of decisive momentum shifts.
Downside bias emerges as price consolidates near key support
Over the next two to three trading days, CRV is expected to trade within a range between $0.3195 support and $0.3553 resistance, with a higher probability of downside moves and a lower probability of sustained gains. The baseline scenario calls for price consolidation within this volatility band barring a breakout. A close above the $0.352 resistance would be needed to signal any material upside shift, while a breach below $0.3195 support could open the door for further declines.
Earlier, analysts noted that Curve remained under sustained bearish pressure amid ongoing governance and technical risks. The latest risk assessment of Curve's cross-chain bridge further reinforces the cautious outlook, making the $0.3195 support level a critical threshold for traders to monitor in the days ahead.








-
 Afghanistan
-
 Albania
-
 Algeria
-
 Angola
-
 Argentina
-
 Armenia
-
 Australia
-
 Austria
-
 Azerbaijan
-
 Bahamas
-
 Bahrain
-
 Bangladesh
-
 Belarus
-
 Belgium
-
 Bolivia
-
 Botswana
-
 Brazil
-
 Brunei
-
 Bulgaria
-
 Cambodia
-
 Cameroon
-
 Canada
-
 Chile
Chile
-
 China
China
-
 Colombia
-
 Congo
Congo
-
 Costa Rica
-
 Cote d'Ivoire
-
 Croatia
-
 Cuba
Cuba
-
 Cyprus
-
 Czechia
-
 DR Congo
-
 Denmark
-
 Dominican Republic
-
 Ecuador
-
 Egypt
Egypt
-
 El Salvador
-
 Estonia
-
 Eswatini
-
 Ethiopia
-
 Finland
-
 France
-
 Georgia
-
 Germany
-
 Ghana
Ghana
-
 Greece
-
 Haiti
Haiti
-
 Hong Kong
-
 Hungary
-
 India
India
-
 Indonesia
-
 Iran, Islamic republic
-
 Iraq
Iraq
-
 Ireland
-
 Israel
-
 Italy
Italy
-
 Jamaica
-
 Japan
Japan
-
 Jordan
-
 Kazakhstan
-
 Kenya
Kenya
-
 Korea
Korea
-
 Kuwait
-
 Kyrgyzstan
-
 Laos
Laos
-
 Latvia
-
 Lebanon
-
 Lesotho
-
 Libya
Libya
-
 Lithuania
-
 Luxembourg
-
 Madagascar
-
 Malaysia
-
 Malta
Malta
-
 Mauritius
-
 Mexico
-
 Moldova
-
 Mongolia
-
 Montenegro
-
 Morocco
-
 Mozambique
-
 Myanmar
-
 Namibia
-
 Nepal
Nepal
-
 Netherlands
-
 New Zealand
-
 Nigeria
-
 North Macedonia
-
 Norway
-
 Oman
Oman
-
 Pakistan
-
 Palestine
-
 Panama
-
 Papua New Guinea
-
 Paraguay
-
 Peru
Peru
-
 Philippines
-
 Poland
-
 Portugal
-
 Puerto Rico
-
 Qatar
Qatar
-
 Reunion
-
 Romania
-
 Rwanda
-
 Saudi Arabia
-
 Serbia
-
 Singapore
-
 Slovakia
-
 Slovenia
-
 Somalia
-
 South Africa
-
 Spain
Spain
-
 Sri Lanka
-
 Sweden
-
 Switzerland
-
 Syria
Syria
-
 Taiwan
-
 Tajikistan
-
 Tanzania
-
 Thailand
-
 Trinidad and Tobago
-
 Tunisia
-
 Turkey
-
 UAE
UAE
-
 Uganda
-
 Ukraine
-
 United Kingdom
-
United States
-
 Uruguay
-
 Uzbekistan
-
 Venezuela
-
 Vietnam
-
 Yemen
Yemen
-
 Zambia
-
 Zimbabwe
- Forex
- Crypto












