

Ethereum weekly outlook: Can ETH retake resistance as bearish momentum tests $2,406 support?

After a near 4% weekly pullback, Ethereum (ETH) is trading just below $2,500 as institutional ETF flows remain a dominant force in the market narrative. With support levels coming into focus and Bitcoin ETF products also drawing headlines, investors are watching how sustained outflows may weigh on sentiment in the week ahead.
 2522.63
2587.28
2522.63
2587.28
Highlights
- Ethereum fell 3.93% over the past 7 days to $2,490, trading below key short-term moving averages.
- Technical momentum remains bearish with daily chart indicators in oversold territory, though signs of seller exhaustion are emerging.
- Expected trading range for the next 7 days is $2,394 to $2,629, with immediate support at $2,406 and resistance at $2,557.
ETF withdrawals and regulatory shifts reshape flows and sentiment this week
Ethereum spot ETFs have logged at least ten consecutive days of net withdrawals, amounting to a roughly $2 billion reduction in assets, according to 24/7 Wall St. The SEC recently approved 3x-leveraged ETFs for both Bitcoin and Ethereum, broadening the landscape of investment vehicles tied to ETH, Coingeek reported. Meanwhile, further attention is on protocol changes, with the completion of the Glamsterdam upgrade on the Sepolia testnet and discussions around regulatory oversight highlighted by new proposals from the U.S. CFTC (source: FXStreet).
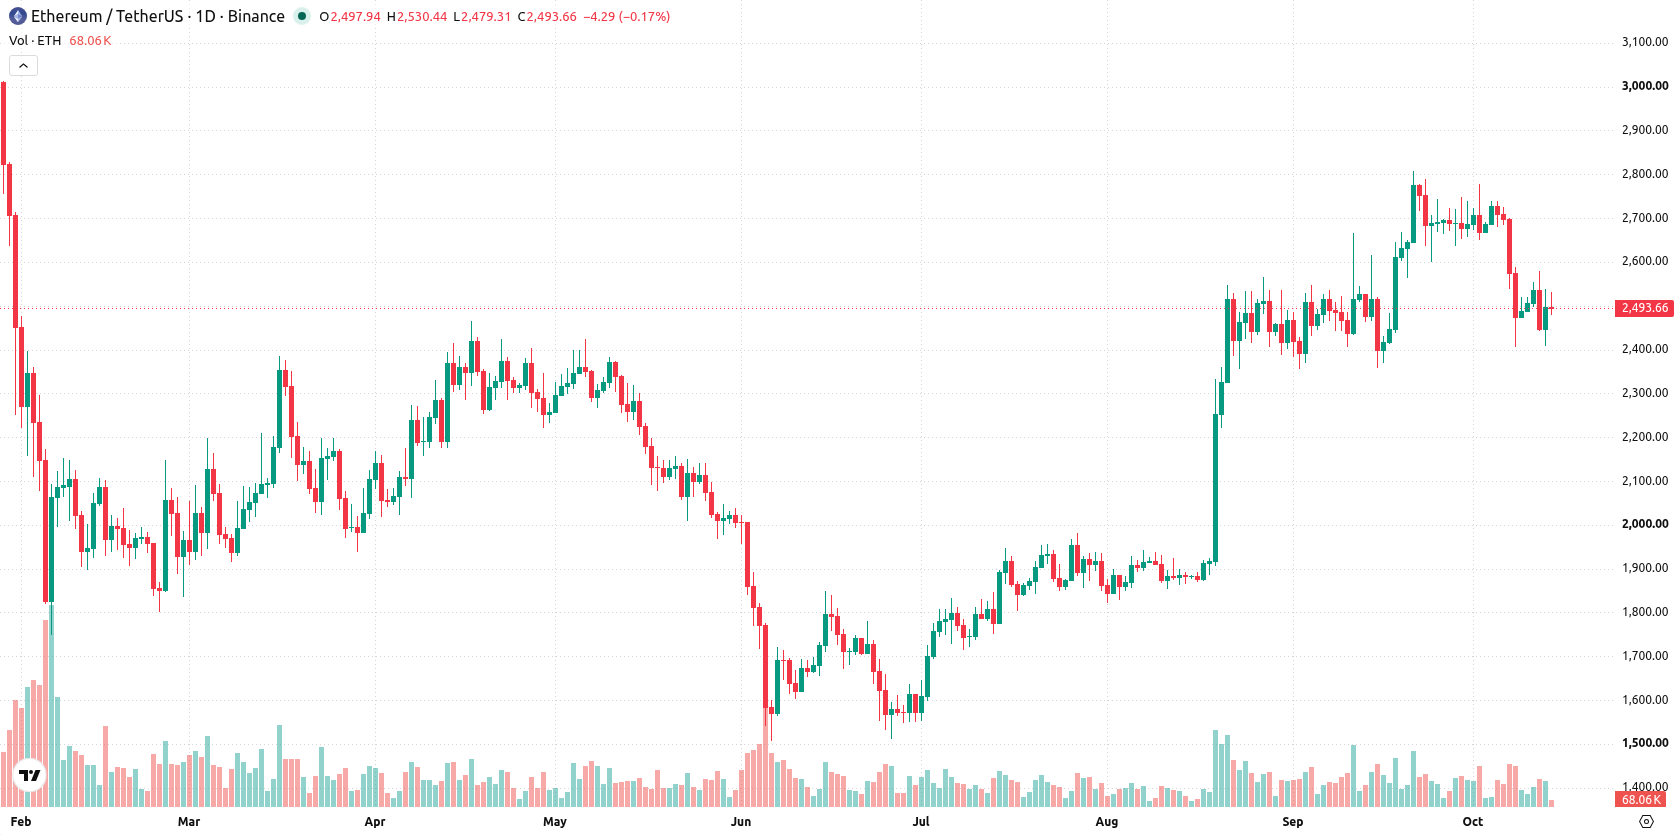
Bearish bias intensifies as weekly momentum indicators approach exhaustion
The daily chart shows a trending phase as Ethereum sustains a move lower with a firm trend. Volatility reached 7.53% for the week, highlighting sizable price swings. Momentum indicators flag a bearish bias, with the CCI at -117.98 in oversold territory, while the Stochastic RSI at 25.08 is approaching oversold—signaling ongoing selling pressure, but also an early sign of exhaustion. Immediate support lies at $2,406, with resistance from the 50-day moving average at $2,557 and the Ichimoku Kijun acting as a practical ceiling at $2,606.
Consolidation likely next week as momentum extremes and breakout risks build
Over the next 7 days, the expected trading range is $2,394 to $2,629, with a 52% probability of an increase and a 48% probability of a decrease. The base case is consolidation inside this range, with the price likely to react to momentum extremes. A bullish scenario would require a break above resistance at $2,557, potentially retesting $2,606. A bearish scenario would materialize if support at $2,406 gives way, opening the door for further weakness toward $2,394.
Earlier, analysts noted that Ethereum was exhibiting low volatility and range-bound trading, with mixed technical signals and no clear directional bias. The latest developments reinforce a cautiously consolidative scenario, with traders advised to watch for a decisive move outside the $2,394 to $2,629 range as a potential catalyst for the next significant price direction.











-
 Afghanistan
-
 Albania
-
 Algeria
-
 Angola
-
 Argentina
-
 Armenia
-
 Australia
-
 Austria
-
 Azerbaijan
-
 Bahamas
-
 Bahrain
-
 Bangladesh
-
 Belarus
-
 Belgium
-
 Bolivia
-
 Botswana
-
 Brazil
-
 Brunei
-
 Bulgaria
-
 Cambodia
-
 Cameroon
-
 Canada
-
 Chile
Chile
-
 China
China
-
 Colombia
-
 Congo
Congo
-
 Costa Rica
-
 Cote d'Ivoire
-
 Croatia
-
 Cuba
Cuba
-
 Cyprus
-
 Czechia
-
 DR Congo
-
 Denmark
-
 Dominican Republic
-
 Ecuador
-
 Egypt
Egypt
-
 El Salvador
-
 Estonia
-
 Eswatini
-
 Ethiopia
-
 Finland
-
 France
-
 Georgia
-
 Germany
-
 Ghana
Ghana
-
 Greece
-
 Haiti
Haiti
-
 Hong Kong
-
 Hungary
-
 India
India
-
 Indonesia
-
 Iran, Islamic republic
-
 Iraq
Iraq
-
 Ireland
-
 Israel
-
 Italy
Italy
-
 Jamaica
-
 Japan
Japan
-
 Jordan
-
 Kazakhstan
-
 Kenya
Kenya
-
 Korea
Korea
-
 Kuwait
-
 Kyrgyzstan
-
 Laos
Laos
-
 Latvia
-
 Lebanon
-
 Lesotho
-
 Libya
Libya
-
 Lithuania
-
 Luxembourg
-
 Madagascar
-
 Malaysia
-
 Malta
Malta
-
 Mauritius
-
 Mexico
-
 Moldova
-
 Mongolia
-
 Montenegro
-
 Morocco
-
 Mozambique
-
 Myanmar
-
 Namibia
-
 Nepal
Nepal
-
 Netherlands
-
 New Zealand
-
 Nigeria
-
 North Macedonia
-
 Norway
-
 Oman
Oman
-
 Pakistan
-
 Palestine
-
 Panama
-
 Papua New Guinea
-
 Paraguay
-
 Peru
Peru
-
 Philippines
-
 Poland
-
 Portugal
-
 Puerto Rico
-
 Qatar
Qatar
-
 Reunion
-
 Romania
-
 Rwanda
-
 Saudi Arabia
-
 Serbia
-
 Singapore
-
 Slovakia
-
 Slovenia
-
 Somalia
-
 South Africa
-
 Spain
Spain
-
 Sri Lanka
-
 Sweden
-
 Switzerland
-
 Syria
Syria
-
 Taiwan
-
 Tajikistan
-
 Tanzania
-
 Thailand
-
 Trinidad and Tobago
-
 Tunisia
-
 Turkey
-
 UAE
UAE
-
 Uganda
-
 Ukraine
-
 United Kingdom
-
United States
-
 Uruguay
-
 Uzbekistan
-
 Venezuela
-
 Vietnam
-
 Yemen
Yemen
-
 Zambia
-
 Zimbabwe
- Forex
- Crypto












