


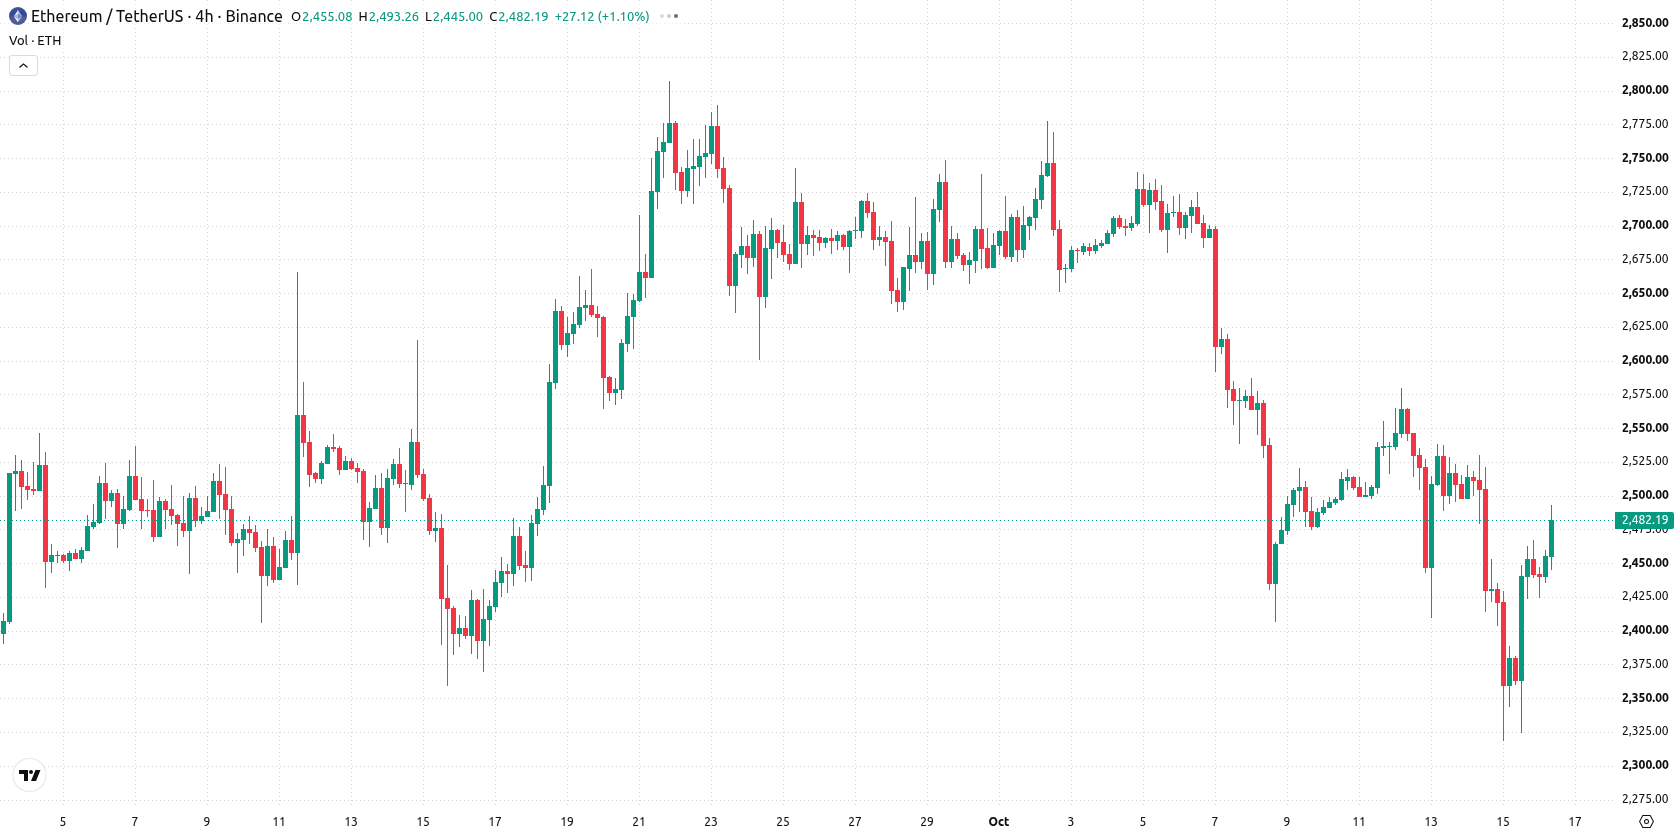
Ethereum (ETH) jumped 4.87% after a wave of crypto liquidations triggered sharp volatility, with investors forcing leveraged positions to close. The upside appears limited as ETH trades below its 20-day and 50-day moving averages, pointing to ongoing technical pressure despite today's rebound.
 2259.15
2391.55
Highlights
- Nearly $1 billion in crypto positions were forcibly closed as Ethereum experienced market volatility on October 15, 2026.
- US spot Ethereum ETFs recorded net outflows of $129.5 million on October 14 and $60.22 million on October 15, continuing large investor redemptions.
- ETH/USD trades below short- and medium-term moving averages with downside momentum, and is forecast to range between $2,351 and $2,613 over the next five sessions.
Institutional outflows persist as inflation data sparks liquidations
Ethereum was swept up in market volatility following hotter-than-expected US inflation data, which drove widespread liquidations across major cryptocurrencies and led to nearly $1 billion in forced position closures on October 15, 2026. Institutional sentiment remained cautious as US spot Ethereum ETFs posted significant net outflows of $129.5 million on October 14 and $60.22 million on October 15, continuing a pattern of redemptions that signals reduced demand from large investors. Meanwhile, Ethereum’s founder Vitalik Buterin emphasized upcoming improvements to protocol security through advanced cryptographic proofs, hinting at long-term technical enhancements.
Downside risk dominates as sell signals and resistance cap gains
ETH/USD trades below its 20-day and 50-day moving averages at $2,601 and $2,555, signaling sustained short- and medium-term selling pressure. However, the pair remains above its 200-day average at $2,143, underscoring continued long-term support. Key resistance is clustered at $2,555 and the Ichimoku Kijun at $2,562, while immediate support is established at $2,458. Momentum indicators are weak, with MACD and ADX both producing a sell bias. RSI reads 40.79 with a 'Sell' signal, and both Stochastic RSI and CCI confirm deeply oversold conditions. The Bull/Bear Power indicator remains negative, and the Awesome Oscillator supports the prevailing downside, highlighting that sellers are dominating intraday action. Intraday volatility stands at 1.39%, and the current price is near session highs. Despite the day's sharp gains and an upside gap at the open, trading momentum and oscillators indicate that broader downside risks persist.
Earlier, analysts noted that Ethereum’s price action was likely to consolidate within a defined range amid persistent institutional outflows and uncertainty around regulated staking products. The current technical setup underscores ongoing downside risks, making $2,458 a pivotal support level to monitor for potential shifts in short-term direction.











-
 Afghanistan
-
 Albania
-
 Algeria
-
 Angola
-
 Argentina
-
 Armenia
-
 Australia
-
 Austria
-
 Azerbaijan
-
 Bahamas
-
 Bahrain
-
 Bangladesh
-
 Belarus
-
 Belgium
-
 Bolivia
-
 Botswana
-
 Brazil
-
 Brunei
-
 Bulgaria
-
 Cambodia
-
 Cameroon
-
 Canada
-
 Chile
-
 China
-
 Colombia
-
 Congo
-
 Costa Rica
-
 Cote d'Ivoire
-
 Croatia
-
 Cuba
-
 Cyprus
-
 Czechia
-
 DR Congo
-
 Denmark
-
 Dominican Republic
-
 Ecuador
-
 Egypt
-
 El Salvador
-
 Estonia
-
 Eswatini
-
 Ethiopia
-
 Finland
-
 France
-
 Georgia
-
 Germany
-
 Ghana
-
 Greece
-
 Haiti
-
 Hong Kong
-
 Hungary
-
 India
-
 Indonesia
-
 Iran, Islamic republic
-
 Iraq
-
 Ireland
-
 Israel
-
 Italy
-
 Jamaica
-
 Japan
-
 Jordan
-
 Kazakhstan
-
 Kenya
-
 Korea
-
 Kuwait
-
 Kyrgyzstan
-
 Laos
-
 Latvia
-
 Lebanon
-
 Lesotho
-
 Libya
-
 Lithuania
-
 Luxembourg
-
 Madagascar
-
 Malaysia
-
 Malta
-
 Mauritius
-
 Mexico
-
 Moldova
-
 Mongolia
-
 Montenegro
-
 Morocco
-
 Mozambique
-
 Myanmar
-
 Namibia
-
 Nepal
-
 Netherlands
-
 New Zealand
-
 Nigeria
-
 North Macedonia
-
 Norway
-
 Oman
-
 Pakistan
-
 Palestine
-
 Panama
-
 Papua New Guinea
-
 Paraguay
-
 Peru
-
 Philippines
-
 Poland
-
 Portugal
-
 Puerto Rico
-
 Qatar
-
 Reunion
-
 Romania
-
 Rwanda
-
 Saudi Arabia
-
 Serbia
-
 Singapore
-
 Slovakia
-
 Slovenia
-
 Somalia
-
 South Africa
-
 Spain
-
 Sri Lanka
-
 Sweden
-
 Switzerland
-
 Syria
-
 Taiwan
-
 Tajikistan
-
 Tanzania
-
 Thailand
-
 Trinidad and Tobago
-
 Tunisia
-
 Turkey
-
 UAE
-
 Uganda
-
 Ukraine
-
 United Kingdom
-
United States
-
 Uruguay
-
 Uzbekistan
-
 Venezuela
-
 Vietnam
-
 Yemen
-
 Zambia
-
 Zimbabwe
- Forex
- Crypto












