

Bitcoin consolidates while ETF inflows and oversold RSI support stability

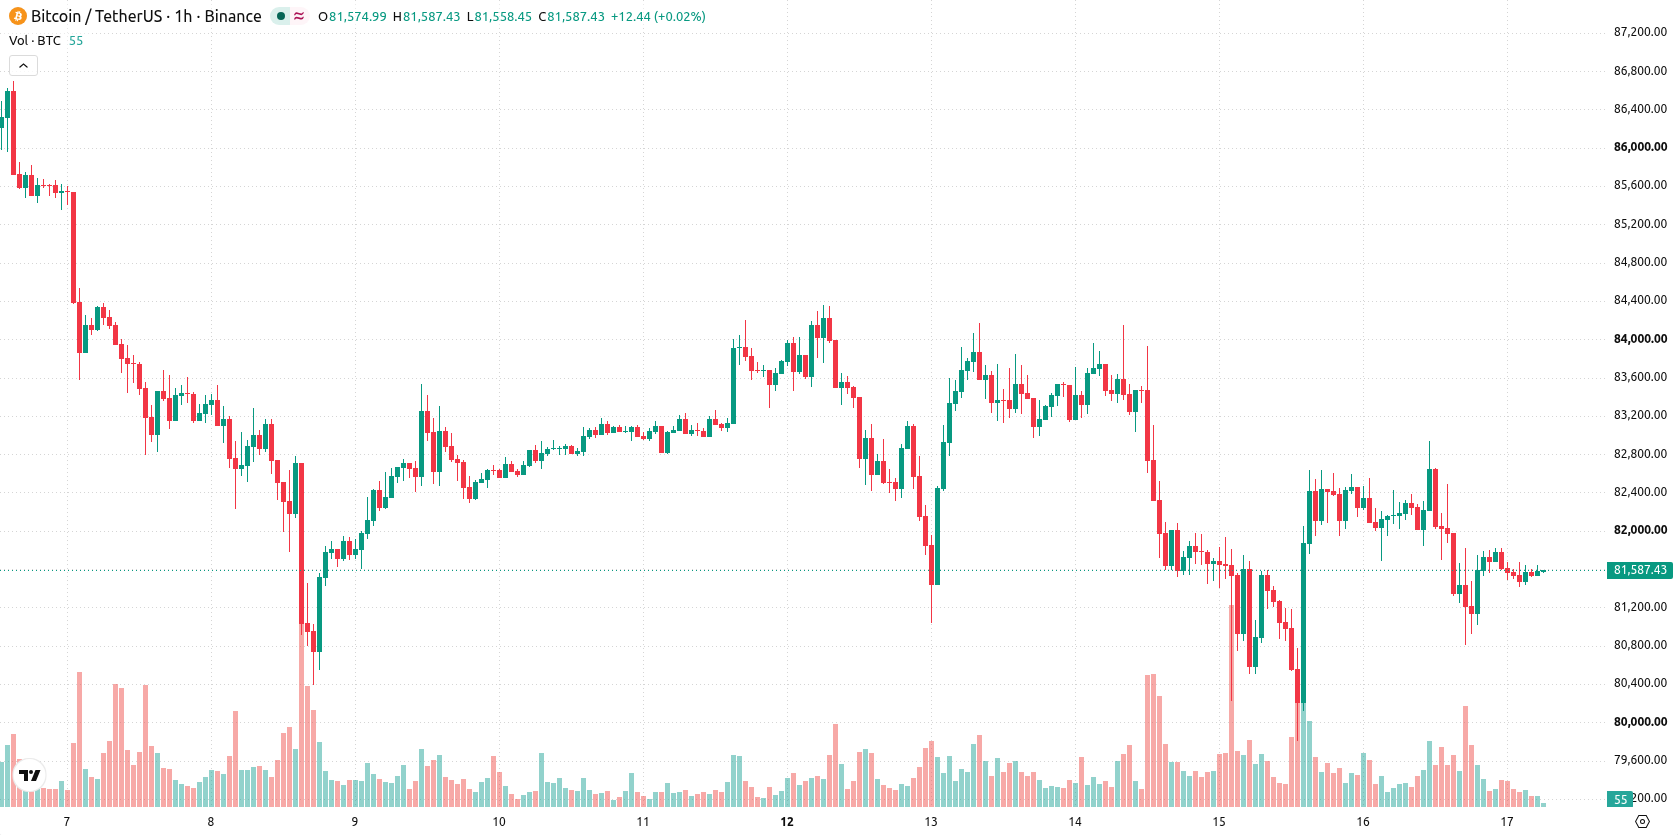
Bitcoin (BTC) is trading at $81,570, showing a modest decline for the day. The price remains below its short- and medium-term moving averages, though it is still above key long-term levels.
 82295.47
84352.00
82295.47
84352.00
Highlights
- U.S. spot Bitcoin ETFs recorded $5.06 million in net inflows for the session, led by $16.79 million into BlackRock’s IBIT.
- U.S. Bitcoin miners earned $1.12 billion in October 2026, supported by resilient post-halving hashprice levels.
- BTC/USD trades below key moving averages with strong short-term downside momentum, expected to range from $80,552 to $82,630 in the coming days.
Institutional inflows and import shift support U.S. Bitcoin demand
U.S. spot Bitcoin ETFs recorded combined net inflows of approximately $5.06 million during the most recent trading session, with BlackRock’s iShares Bitcoin Trust (IBIT) leading with $16.79 million in new inflows, according to Crypto. This activity reflects sustained institutional allocation into Bitcoin through regulated fund vehicles, offering a modest stabilizing force via steady demand. Meanwhile, U.S. Bitcoin miners earned around $1.12 billion in October 2026 amid robust hashprice levels following the 2024 halving, data from Shattered reported, providing resilience to the mining sector’s cash flow. Additionally, the United States became a net importer of Bitcoin for the first time since 2022 due to heightened institutional investor inflows, Finance Biggo noted, shifting the regional balance of Bitcoin liquidity.
Downside momentum persists as oscillators signal seller dominance
BTC is currently trading below the MA-20 and MA-50 on the hourly chart, pointing to prevailing short- and medium-term resistance, while the daily MA-200 at lower levels continues to provide underlying support. The Ichimoku Kijun sits at $81,875 as immediate resistance. Momentum indicators show MACD at Strong Sell and ADX as Neutral, with RSI reading 45.75 in Sell territory, while both Stochastic RSI and CCI are Neutral. Bull/Bear Power is Oversold, confirming intraday seller dominance and divergence among some oscillators.
Downside risk prevails as range-bound outlook dominates short term
Over the next two to three trading days, the expected movement for BTC is within a volatility band of $80,552 to $82,630. The base scenario is range-bound action within this corridor. An upside breakout is only likely if the price advances above $81,875, which could open the door for additional gains. If BTC closes below $80,552, further downside acceleration is possible, with the probability of a downward move assessed as much higher than an upward attempt in the short term.
Previously it was reported that Charles Schwab expanded its digital asset offerings by enabling retail clients to trade Bitcoin and Ethereum directly through its Schwab Crypto platform. This new layer of institutional inflows and U.S. Bitcoin imports highlighted in the current session adds further significance to established support levels, with particular attention warranted on the $80,552 threshold as a downside risk in the days ahead.











-
 Afghanistan
-
 Albania
-
 Algeria
-
 Angola
-
 Argentina
-
 Armenia
-
 Australia
-
 Austria
-
 Azerbaijan
-
 Bahamas
-
 Bahrain
-
 Bangladesh
-
 Belarus
-
 Belgium
-
 Bolivia
-
 Botswana
-
 Brazil
-
 Brunei
-
 Bulgaria
-
 Cambodia
-
 Cameroon
-
 Canada
-
 Chile
Chile
-
 China
China
-
 Colombia
-
 Congo
Congo
-
 Costa Rica
-
 Cote d'Ivoire
-
 Croatia
-
 Cuba
Cuba
-
 Cyprus
-
 Czechia
-
 DR Congo
-
 Denmark
-
 Dominican Republic
-
 Ecuador
-
 Egypt
Egypt
-
 El Salvador
-
 Estonia
-
 Eswatini
-
 Ethiopia
-
 Finland
-
 France
-
 Georgia
-
 Germany
-
 Ghana
Ghana
-
 Greece
-
 Haiti
Haiti
-
 Hong Kong
-
 Hungary
-
 India
India
-
 Indonesia
-
 Iran, Islamic republic
-
 Iraq
Iraq
-
 Ireland
-
 Israel
-
 Italy
Italy
-
 Jamaica
-
 Japan
Japan
-
 Jordan
-
 Kazakhstan
-
 Kenya
Kenya
-
 Korea
Korea
-
 Kuwait
-
 Kyrgyzstan
-
 Laos
Laos
-
 Latvia
-
 Lebanon
-
 Lesotho
-
 Libya
Libya
-
 Lithuania
-
 Luxembourg
-
 Madagascar
-
 Malaysia
-
 Malta
Malta
-
 Mauritius
-
 Mexico
-
 Moldova
-
 Mongolia
-
 Montenegro
-
 Morocco
-
 Mozambique
-
 Myanmar
-
 Namibia
-
 Nepal
Nepal
-
 Netherlands
-
 New Zealand
-
 Nigeria
-
 North Macedonia
-
 Norway
-
 Oman
Oman
-
 Pakistan
-
 Palestine
-
 Panama
-
 Papua New Guinea
-
 Paraguay
-
 Peru
Peru
-
 Philippines
-
 Poland
-
 Portugal
-
 Puerto Rico
-
 Qatar
Qatar
-
 Reunion
-
 Romania
-
 Rwanda
-
 Saudi Arabia
-
 Serbia
-
 Singapore
-
 Slovakia
-
 Slovenia
-
 Somalia
-
 South Africa
-
 Spain
Spain
-
 Sri Lanka
-
 Sweden
-
 Switzerland
-
 Syria
Syria
-
 Taiwan
-
 Tajikistan
-
 Tanzania
-
 Thailand
-
 Trinidad and Tobago
-
 Tunisia
-
 Turkey
-
 UAE
UAE
-
 Uganda
-
 Ukraine
-
 United Kingdom
-
United States
-
 Uruguay
-
 Uzbekistan
-
 Venezuela
-
 Vietnam
-
 Yemen
Yemen
-
 Zambia
-
 Zimbabwe
- Forex
- Crypto












