


Saros (SAROS) slid 10.75% as bearish momentum and the absence of fresh catalysts deepened selling pressure. The down move is further supported by the asset's position below its long-term 200-day moving average, underscoring the sustained weakness.
 0.0001
28
Highlights
- SAROS/USD is trading above its short- and medium-term moving averages but remains below the long-term resistance at $0.0004.
- Momentum indicators are mixed, with some signaling a buy and others showing neutral conditions, and intraday action has been muted with no volatility.
- The expected 5-day price range is $0.0002 to $0.0004, with a slight upward bias and price likely to remain sideways near current levels.
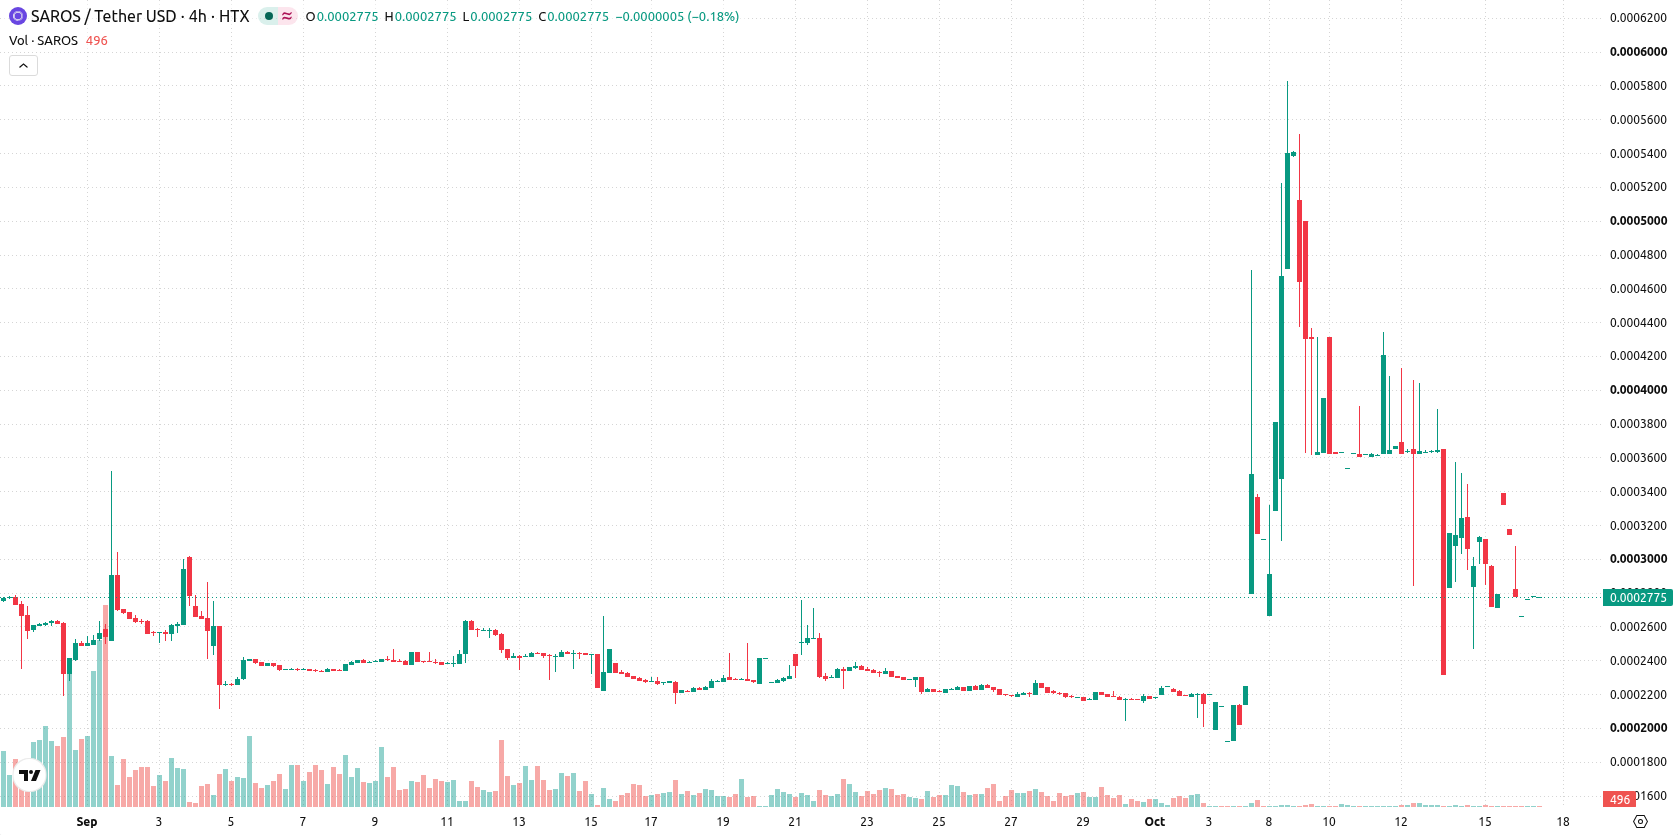
Short-term positive signals coexist with long-term resistance and muted momentum
SAROS/USD currently trades above its 20-day and 50-day moving averages at $0.0003, but remains below the 200-day level at $0.0004. This short- and medium-term positioning signals mild upward bias, yet the long-term trend holds a bearish undertone with resistance at $0.0004 and support at $0.0002. Momentum indicators paint a mixed picture: Moving Average Convergence Divergence (MACD) and Average Directional Index (ADX) both signal buy conditions, indicating positive momentum. The Relative Strength Index (RSI) stands at 51.81 with a buy forecast, suggesting no overbought or oversold conditions. Stochastic RSI and Commodity Channel Index (CCI) both read as neutral. Bull/Bear Power (BBP) at 0 points to buyer dominance intraday. Awesome Oscillator is neutral, not providing additional confirmation. Today the asset opened nearly flat and has not moved from $0.0003, showing a daily change of 0 and slipping 10.75%. There was no intraday volatility, with a range tightly held at $0.0003 and an amplitude of 0.00%. The intraday tone is muted and consolidative, with a lack of directional momentum reflected in both the price and oscillators.
Earlier, analysts noted that Saros was under sustained bearish pressure with limited signs of reversal. The latest analysis reinforces this view, highlighting continued consolidation and emphasizing the need for traders to monitor $0.0004 as a key resistance level that could trigger a shift in market direction if breached.






Latest Saros News




-
 Afghanistan
-
 Albania
-
 Algeria
-
 Angola
-
 Argentina
-
 Armenia
-
 Australia
-
 Austria
-
 Azerbaijan
-
 Bahamas
-
 Bahrain
-
 Bangladesh
-
 Belarus
-
 Belgium
-
 Bolivia
-
 Botswana
-
 Brazil
-
 Brunei
-
 Bulgaria
-
 Cambodia
-
 Cameroon
-
 Canada
-
 Chile
-
 China
-
 Colombia
-
 Congo
-
 Costa Rica
-
 Cote d'Ivoire
-
 Croatia
-
 Cuba
-
 Cyprus
-
 Czechia
-
 DR Congo
-
 Denmark
-
 Dominican Republic
-
 Ecuador
-
 Egypt
-
 El Salvador
-
 Estonia
-
 Eswatini
-
 Ethiopia
-
 Finland
-
 France
-
 Georgia
-
 Germany
-
 Ghana
-
 Greece
-
 Haiti
-
 Hong Kong
-
 Hungary
-
 India
-
 Indonesia
-
 Iran, Islamic republic
-
 Iraq
-
 Ireland
-
 Israel
-
 Italy
-
 Jamaica
-
 Japan
-
 Jordan
-
 Kazakhstan
-
 Kenya
-
 Korea
-
 Kuwait
-
 Kyrgyzstan
-
 Laos
-
 Latvia
-
 Lebanon
-
 Lesotho
-
 Libya
-
 Lithuania
-
 Luxembourg
-
 Madagascar
-
 Malaysia
-
 Malta
-
 Mauritius
-
 Mexico
-
 Moldova
-
 Mongolia
-
 Montenegro
-
 Morocco
-
 Mozambique
-
 Myanmar
-
 Namibia
-
 Nepal
-
 Netherlands
-
 New Zealand
-
 Nigeria
-
 North Macedonia
-
 Norway
-
 Oman
-
 Pakistan
-
 Palestine
-
 Panama
-
 Papua New Guinea
-
 Paraguay
-
 Peru
-
 Philippines
-
 Poland
-
 Portugal
-
 Puerto Rico
-
 Qatar
-
 Reunion
-
 Romania
-
 Rwanda
-
 Saudi Arabia
-
 Serbia
-
 Singapore
-
 Slovakia
-
 Slovenia
-
 Somalia
-
 South Africa
-
 Spain
-
 Sri Lanka
-
 Sweden
-
 Switzerland
-
 Syria
-
 Taiwan
-
 Tajikistan
-
 Tanzania
-
 Thailand
-
 Trinidad and Tobago
-
 Tunisia
-
 Turkey
-
 UAE
-
 Uganda
-
 Ukraine
-
 United Kingdom
-
United States
-
 Uruguay
-
 Uzbekistan
-
 Venezuela
-
 Vietnam
-
 Yemen
-
 Zambia
-
 Zimbabwe
- Forex
- Crypto












