

Saros technical analysis: Downward move puts pressure on $0.0001 support

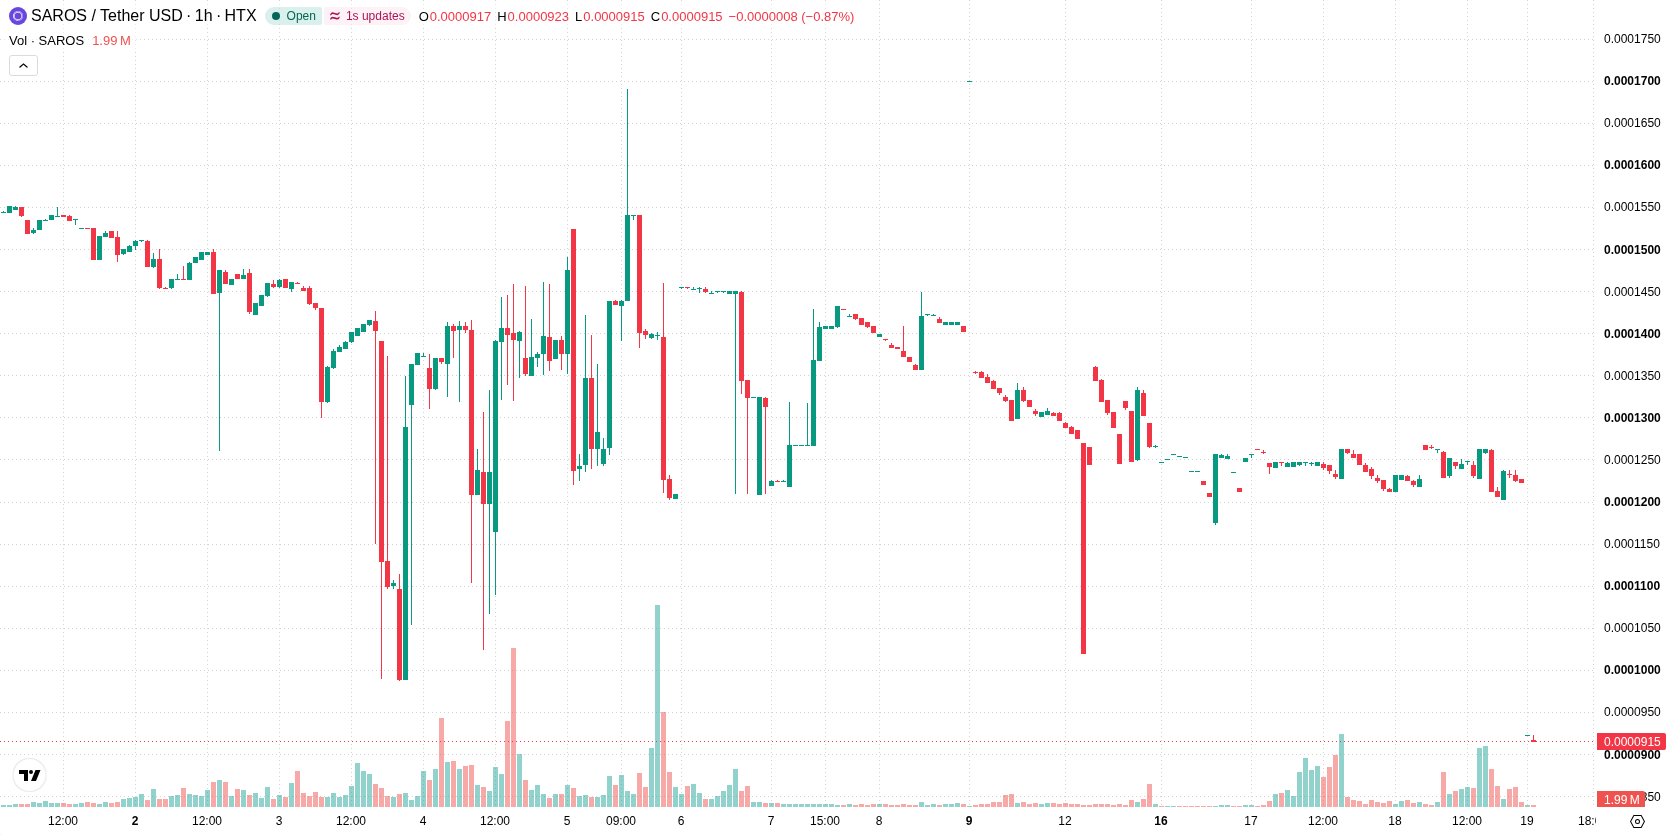
Saros (SAROS) is trading at $0.0001, marking a daily decline of 9.64%. The move leaves the price above its key short-term and medium-term moving averages, but under the longer-term average.
 0.0001
32
Highlights
- SAROS/USD trades above key short-term averages but remains below long-term resistance, with short- and medium-term support still present.
- Momentum indicators issue strong sell signals, with oversold conditions on some oscillators and no definitive upside triggers identified.
- SAROS/USD is projected to hold a $0.0001 to $0.0001 range over the next 2 to 3 days, with a high probability of further declines.
Downside momentum persists as technical supports limit further losses
On the technical side, SAROS/USD is positioned above the H1 SMA-20 at $0.0001 and the H1 SMA-50 at $0.0001, but trades below the D1 SMA-200 at $0.0003. The Ichimoku Kijun on the daily chart provides immediate support at $0.0001. Momentum indicators show a strong sell signal from MACD and a sell reading from ADX, confirming persistent downside pressure. RSI and Stoch RSI are both neutral, while CCI is oversold, highlighting potential exhaustion on the downside. Bull/Bear Power is neutral, suggesting neither buyers nor sellers have dominance.
Further declines favored as limited rebound potential caps outlook
Over the next 2–3 trading days, SAROS/USD is expected to remain within a narrow consolidation band between $0.0001 and $0.0001. A potential rebound scenario is unlikely given current momentum, and the probability of further declines is elevated. Should the price break below immediate support, further downside may accelerate; conversely, an upside move would require a decisive push above the nearest resistance.
Earlier, analysts noted that Saros was facing ongoing downside risks amid bearish technical signals. The latest technical readings reinforce this outlook, highlighting immediate support at $0.0001 as a critical level for traders to monitor in the near term.










-
 Afghanistan
-
 Albania
-
 Algeria
-
 Angola
-
 Argentina
-
 Armenia
-
 Australia
-
 Austria
-
 Azerbaijan
-
 Bahamas
-
 Bahrain
-
 Bangladesh
-
 Belarus
-
 Belgium
-
 Bolivia
-
 Botswana
-
 Brazil
-
 Brunei
-
 Bulgaria
-
 Cambodia
-
 Cameroon
-
 Canada
-
 Chile
-
 China
-
 Colombia
-
 Congo
-
 Costa Rica
-
 Cote d'Ivoire
-
 Croatia
-
 Cuba
-
 Cyprus
-
 Czechia
-
 DR Congo
-
 Denmark
-
 Dominican Republic
-
 Ecuador
-
 Egypt
-
 El Salvador
-
 Estonia
-
 Eswatini
-
 Ethiopia
-
 Finland
-
 France
-
 Georgia
-
 Germany
-
 Ghana
-
 Greece
-
 Haiti
-
 Hong Kong
-
 Hungary
-
 India
-
 Indonesia
-
 Iran, Islamic republic
-
 Iraq
-
 Ireland
-
 Israel
-
 Italy
-
 Jamaica
-
 Japan
-
 Jordan
-
 Kazakhstan
-
 Kenya
-
 Korea
-
 Kuwait
-
 Kyrgyzstan
-
 Laos
-
 Latvia
-
 Lebanon
-
 Lesotho
-
 Libya
-
 Lithuania
-
 Luxembourg
-
 Madagascar
-
 Malaysia
-
 Malta
-
 Mauritius
-
 Mexico
-
 Moldova
-
 Mongolia
-
 Montenegro
-
 Morocco
-
 Mozambique
-
 Myanmar
-
 Namibia
-
 Nepal
-
 Netherlands
-
 New Zealand
-
 Nigeria
-
 North Macedonia
-
 Norway
-
 Oman
-
 Pakistan
-
 Palestine
-
 Panama
-
 Papua New Guinea
-
 Paraguay
-
 Peru
-
 Philippines
-
 Poland
-
 Portugal
-
 Puerto Rico
-
 Qatar
-
 Reunion
-
 Romania
-
 Rwanda
-
 Saudi Arabia
-
 Serbia
-
 Singapore
-
 Slovakia
-
 Slovenia
-
 Somalia
-
 South Africa
-
 Spain
-
 Sri Lanka
-
 Sweden
-
 Switzerland
-
 Syria
-
 Taiwan
-
 Tajikistan
-
 Tanzania
-
 Thailand
-
 Trinidad and Tobago
-
 Tunisia
-
 Turkey
-
 UAE
-
 Uganda
-
 Ukraine
-
 United Kingdom
-
United States
-
 Uruguay
-
 Uzbekistan
-
 Venezuela
-
 Vietnam
-
 Yemen
-
 Zambia
-
 Zimbabwe
- Forex
- Crypto












