

SAROS slips as weak momentum persists near $0.0001 support

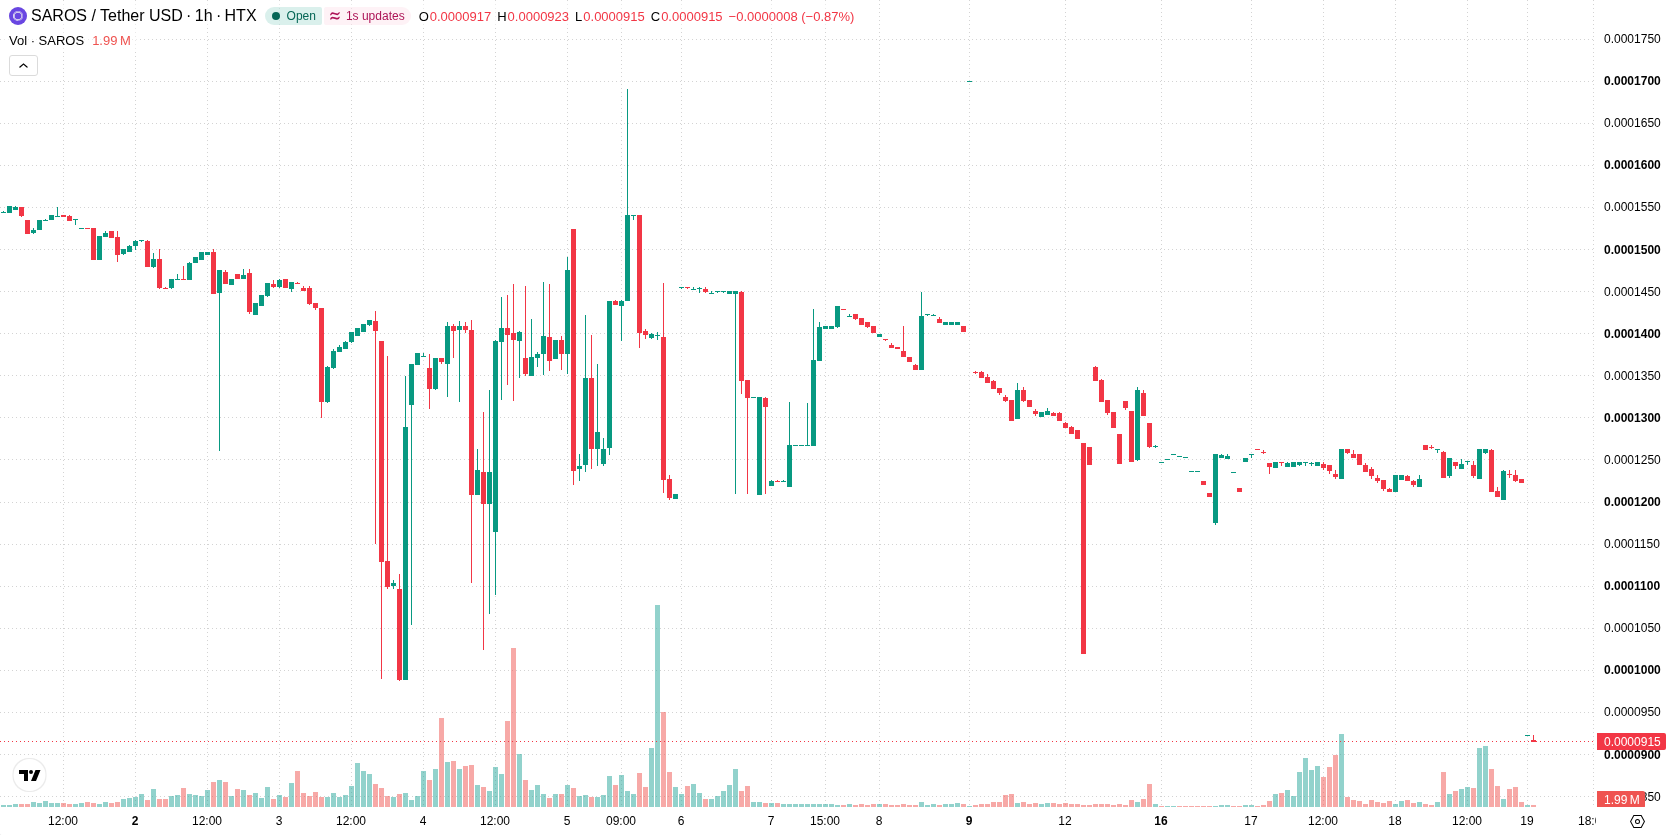
Saros (SAROS) is trading at $0.0001, marking a daily decline of 8.05%. The price currently sits above its key short- and medium-term moving averages, while remaining below longer-term trend levels.
 0.0001
33
Highlights
- SAROS/USD trades at $0.0001, down 8.05% today, and remains below long-term resistance, indicating persistent seller control.
- Technical indicators confirm dominant bearish momentum, with both MACD and ADX supporting strong downward pressure and oversold conditions apparent.
- The expected price range for the next 2 to 3 days is $0.0001 to $0.0001, with a very high probability of further downside.
Bearish momentum persists as support holds above short-term averages
On the technical front, SAROS/USD trades above the H1 SMA-20 at $0.0001 and the H1 SMA-50 at $0.0001, but remains below the D1 SMA-200 at $0.0003. The Ichimoku Kijun on the daily chart serves as immediate support at $0.0001. Momentum indicators confirm a prevailing bearish setup: MACD and ADX both reinforce downward pressure, while the RSI is neutral. Both Stochastic RSI and CCI are in oversold territory, hinting at a possible rebound. Bull/Bear Power holds at 0, indicating a neutral balance between buyers and sellers, and the Awesome Oscillator aligns with bearish momentum.
Rangebound trade likely as further declines outweigh rebound odds
Over the next 2 to 3 trading days, SAROS/USD is expected to remain rangebound between $0.0001 and $0.0001, with a high probability of further downside and a low likelihood of a sustained rebound. The baseline scenario projects the price consolidating close to current levels. If bullish momentum emerges, a recovery attempt above immediate resistance might occur, while a bearish scenario could push the price lower beneath the Ichimoku Kijun support and recent lows.
Earlier, analysts noted that Saros was facing persistent downside risks amid bearish technical signals. The current analysis reinforces that view, highlighting the importance of the Ichimoku Kijun as a key support level that traders should monitor for potential breakdown or reversal scenarios.






Latest Saros News




-
 Afghanistan
-
 Albania
-
 Algeria
-
 Angola
-
 Argentina
-
 Armenia
-
 Australia
-
 Austria
-
 Azerbaijan
-
 Bahamas
-
 Bahrain
-
 Bangladesh
-
 Belarus
-
 Belgium
-
 Bolivia
-
 Botswana
-
 Brazil
-
 Brunei
-
 Bulgaria
-
 Cambodia
-
 Cameroon
-
 Canada
-
 Chile
-
 China
-
 Colombia
-
 Congo
-
 Costa Rica
-
 Cote d'Ivoire
-
 Croatia
-
 Cuba
-
 Cyprus
-
 Czechia
-
 DR Congo
-
 Denmark
-
 Dominican Republic
-
 Ecuador
-
 Egypt
-
 El Salvador
-
 Estonia
-
 Eswatini
-
 Ethiopia
-
 Finland
-
 France
-
 Georgia
-
 Germany
-
 Ghana
-
 Greece
-
 Haiti
-
 Hong Kong
-
 Hungary
-
 India
-
 Indonesia
-
 Iran, Islamic republic
-
 Iraq
-
 Ireland
-
 Israel
-
 Italy
-
 Jamaica
-
 Japan
-
 Jordan
-
 Kazakhstan
-
 Kenya
-
 Korea
-
 Kuwait
-
 Kyrgyzstan
-
 Laos
-
 Latvia
-
 Lebanon
-
 Lesotho
-
 Libya
-
 Lithuania
-
 Luxembourg
-
 Madagascar
-
 Malaysia
-
 Malta
-
 Mauritius
-
 Mexico
-
 Moldova
-
 Mongolia
-
 Montenegro
-
 Morocco
-
 Mozambique
-
 Myanmar
-
 Namibia
-
 Nepal
-
 Netherlands
-
 New Zealand
-
 Nigeria
-
 North Macedonia
-
 Norway
-
 Oman
-
 Pakistan
-
 Palestine
-
 Panama
-
 Papua New Guinea
-
 Paraguay
-
 Peru
-
 Philippines
-
 Poland
-
 Portugal
-
 Puerto Rico
-
 Qatar
-
 Reunion
-
 Romania
-
 Rwanda
-
 Saudi Arabia
-
 Serbia
-
 Singapore
-
 Slovakia
-
 Slovenia
-
 Somalia
-
 South Africa
-
 Spain
-
 Sri Lanka
-
 Sweden
-
 Switzerland
-
 Syria
-
 Taiwan
-
 Tajikistan
-
 Tanzania
-
 Thailand
-
 Trinidad and Tobago
-
 Tunisia
-
 Turkey
-
 UAE
-
 Uganda
-
 Ukraine
-
 United Kingdom
-
United States
-
 Uruguay
-
 Uzbekistan
-
 Venezuela
-
 Vietnam
-
 Yemen
-
 Zambia
-
 Zimbabwe
- Forex
- Crypto












