

Arbitrum technical analysis: Downward price move with sellers in control near $0.1802 support

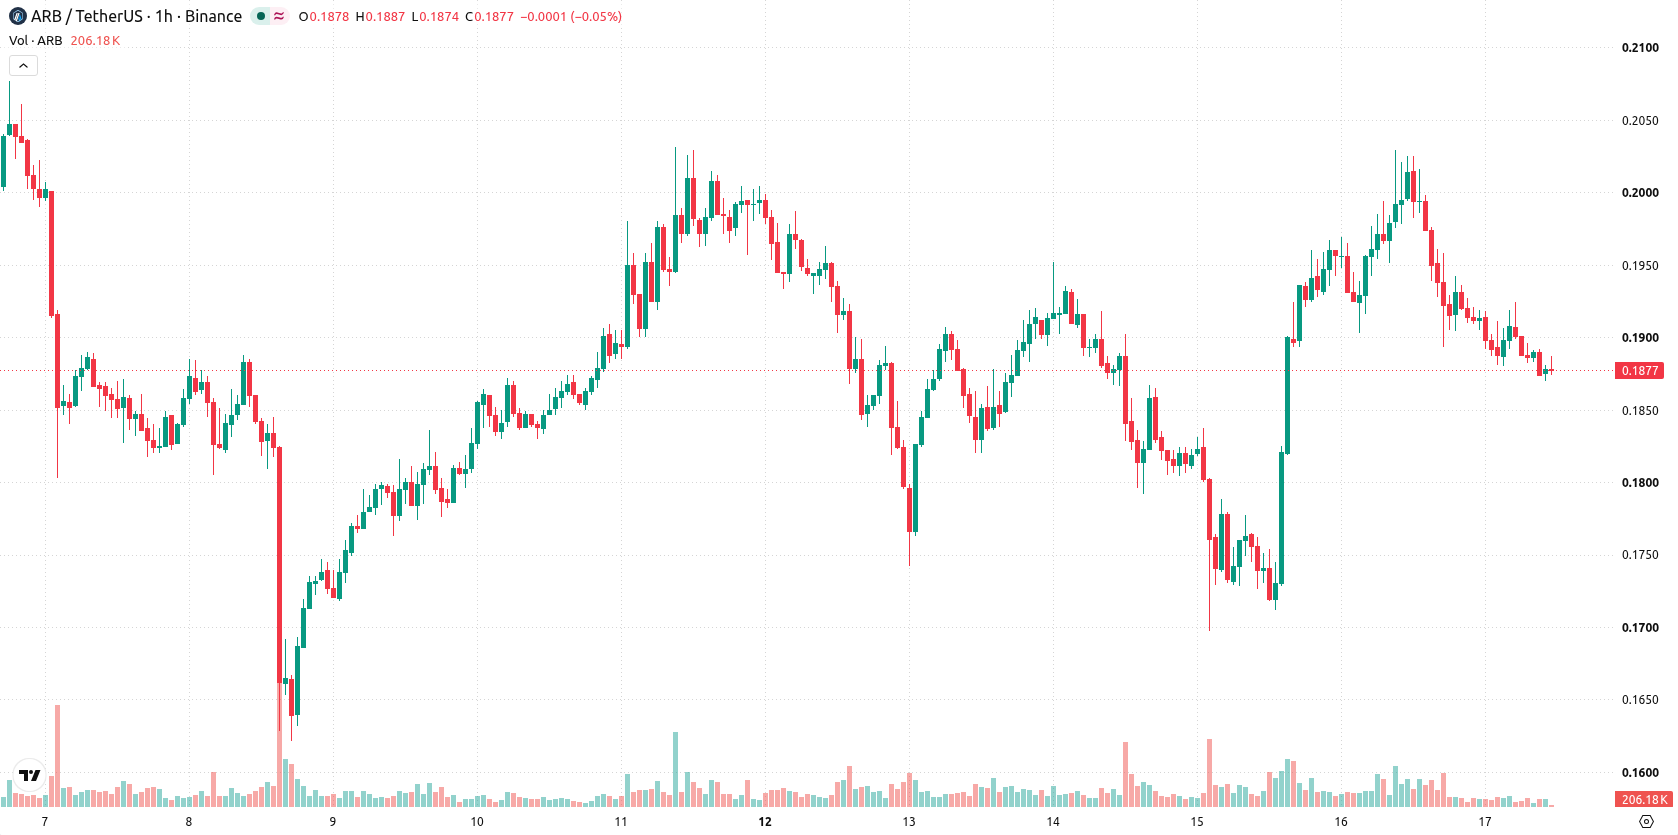
Arbitrum (ARB) is trading at $0.1877 after falling 7.13% on the day, with the price currently located below its short- and medium-term moving averages and staying comfortably above its long-term averages.
 0.1226
0.1459
Highlights
- Arbitrum introduced a 2 million ARB incentive pool to accelerate adoption of USDG as the main stablecoin on Arbitrum One.
- ArbitrumDAO recorded $6.19 million in income in the first half of 2026 from technology licensing fees, with Robinhood Chain contributing $4.37 million in ten weeks.
- ARB/USD trades below key moving averages with bearish momentum, expected to range between $0.1802 and $0.1997 over the next 2 to 3 days.
Stablecoin incentives and fee windfall amid persistent selling pressure
Arbitrum has launched a Stablecoin Growth Program, allocating a 2 million ARB reward pool to encourage ecosystem applications to adopt USDG as their main stablecoin on Arbitrum One, according to Defiprime. This initiative targets higher stablecoin adoption within the network, offering material incentives that may spur increased on-chain activity among partners. In parallel, ArbitrumDAO reported $6.19 million in income in the first half of 2026, primarily derived from licensing fees paid by chains using its technology, with Robinhood Chain alone contributing $4.37 million in its initial ten weeks, as stated by Cryptonomist, though price action has remained under broader selling pressure.
Oversold signals emerge as sellers dominate within defined ranges
On the technical front, ARB/USD has slipped below both the MA-20 ($0.1906) and MA-50 ($0.1911) on the hourly chart, while remaining well above the daily MA-200 at $0.1171. Immediate resistance is seen at the Ichimoku Kijun level of $0.195, and crucial support emerges around $0.1802. Momentum indicators show RSI at 37.47, below neutral, with MACD and Awesome Oscillator both confirming continued downside. Both Stoch RSI and CCI present oversold readings, indicating the potential for an upward correction, whereas a neutral ADX points to a lack of strong trend conviction. Bull/Bear Power signals sustained dominance by sellers in current intraday action.
Downside risk persists as volatility bands constrain relief rally odds
Over the next two to three trading days, ARB/USD is expected to fluctuate within a volatility band defined by support at $0.1802 and resistance at $0.1997. The prevailing scenario suggests continued range-bound trade, with odds favoring further downside extension (77% probability), but with a 23% likelihood of a relief rally should oversold signals prompt buyers to step in. A bullish shift would require a decisive reclaim of the $0.195 resistance level, while a breach of support near $0.1802 could lead to a deeper slide before any stabilization occurs.
Earlier, analysts noted that conflicting technical signals and muted token demand were limiting Arbitrum's upside despite ecosystem growth and increased institutional engagement. The current weakening below key moving averages and persistent selling pressure underscore a shift toward downside risk, making the $0.1802 support level crucial for traders monitoring further potential declines or the prospect of a short-term reversal.






Latest Arbitrum News




-
 Afghanistan
-
 Albania
-
 Algeria
-
 Angola
-
 Argentina
-
 Armenia
-
 Australia
-
 Austria
-
 Azerbaijan
-
 Bahamas
-
 Bahrain
-
 Bangladesh
-
 Belarus
-
 Belgium
-
 Bolivia
-
 Botswana
-
 Brazil
-
 Brunei
-
 Bulgaria
-
 Cambodia
-
 Cameroon
-
 Canada
-
 Chile
-
 China
-
 Colombia
-
 Congo
-
 Costa Rica
-
 Cote d'Ivoire
-
 Croatia
-
 Cuba
-
 Cyprus
-
 Czechia
-
 DR Congo
-
 Denmark
-
 Dominican Republic
-
 Ecuador
-
 Egypt
-
 El Salvador
-
 Estonia
-
 Eswatini
-
 Ethiopia
-
 Finland
-
 France
-
 Georgia
-
 Germany
-
 Ghana
-
 Greece
-
 Haiti
-
 Hong Kong
-
 Hungary
-
 India
-
 Indonesia
-
 Iran, Islamic republic
-
 Iraq
-
 Ireland
-
 Israel
-
 Italy
-
 Jamaica
-
 Japan
-
 Jordan
-
 Kazakhstan
-
 Kenya
-
 Korea
-
 Kuwait
-
 Kyrgyzstan
-
 Laos
-
 Latvia
-
 Lebanon
-
 Lesotho
-
 Libya
-
 Lithuania
-
 Luxembourg
-
 Madagascar
-
 Malaysia
-
 Malta
-
 Mauritius
-
 Mexico
-
 Moldova
-
 Mongolia
-
 Montenegro
-
 Morocco
-
 Mozambique
-
 Myanmar
-
 Namibia
-
 Nepal
-
 Netherlands
-
 New Zealand
-
 Nigeria
-
 North Macedonia
-
 Norway
-
 Oman
-
 Pakistan
-
 Palestine
-
 Panama
-
 Papua New Guinea
-
 Paraguay
-
 Peru
-
 Philippines
-
 Poland
-
 Portugal
-
 Puerto Rico
-
 Qatar
-
 Reunion
-
 Romania
-
 Rwanda
-
 Saudi Arabia
-
 Serbia
-
 Singapore
-
 Slovakia
-
 Slovenia
-
 Somalia
-
 South Africa
-
 Spain
-
 Sri Lanka
-
 Sweden
-
 Switzerland
-
 Syria
-
 Taiwan
-
 Tajikistan
-
 Tanzania
-
 Thailand
-
 Trinidad and Tobago
-
 Tunisia
-
 Turkey
-
 UAE
-
 Uganda
-
 Ukraine
-
 United Kingdom
-
United States
-
 Uruguay
-
 Uzbekistan
-
 Venezuela
-
 Vietnam
-
 Yemen
-
 Zambia
-
 Zimbabwe
- Forex
- Crypto












