

The Graph support comes into focus after a stretched decline: weekly analysis

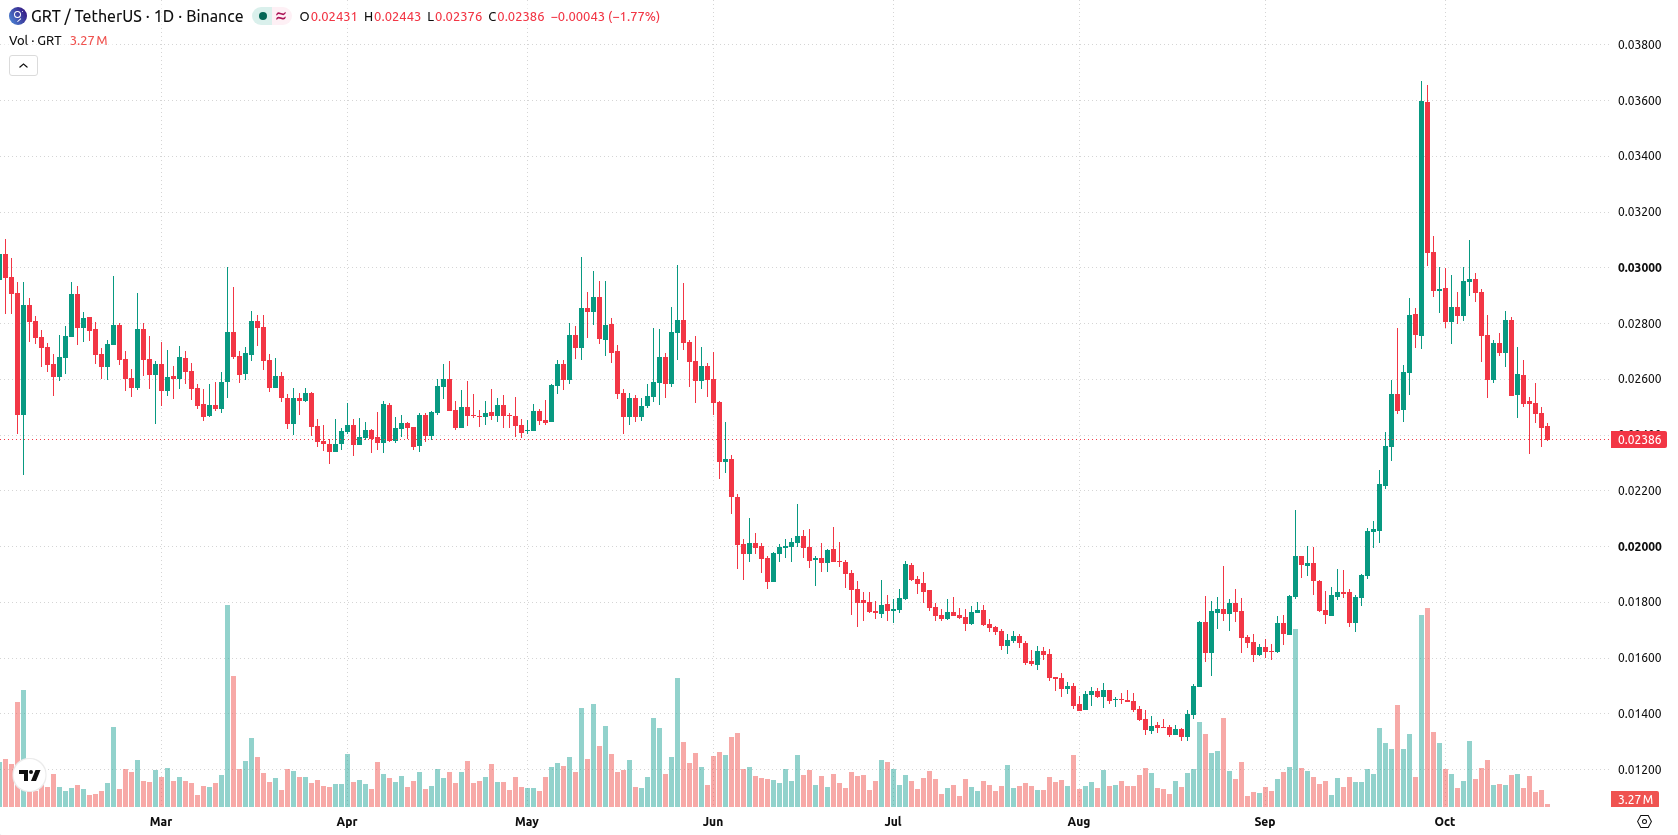
The Graph (GRT) is hovering near $0.024 after declining more than 10% in the past week. Momentum has remained firmly bearish with the market pressing into oversold conditions, and the focus now shifts to whether support can stabilize price action in the coming days.
 0.01582
0.01780000
Highlights
- The Graph trades at $0.02385, declining 10.94% over the past week, with the trend currently lower on the daily chart.
- Technical indicators show oversold conditions with sustained bearish momentum and immediate support at $0.02332.
- Price is projected to fluctuate between $0.02126245 and $0.02742 over the coming week, with 52% probability of further downside.
Momentum holds bearish as technical signals deepen oversold state this week
On the daily chart, the trend is firmly lower, with momentum characterized as a sustained move lower with a firm trend and seven-day volatility at 20.97%. Both the CCI at -129.93 and a Stochastic RSI of 0 have entered the oversold zone, while trend-based signals such as ADX and Bull/Bear Power remain bearish. Immediate support lies at $0.02332, with overhead resistance at $0.0274715 and the Ichimoku Kijun serving as a higher resistance reference.
Sideline bias this week as breakout hinges on support or resistance breach
Over the coming week, The Graph is expected to trade in a range between $0.02126245 and $0.02742. The probability of a decrease is 52%, while an advance stands at 48%. The base case is for price action to unfold inside this band, while a clear move above $0.0274715 would tilt momentum bullishly. Conversely, a drop below $0.02332 would confirm a deeper retracement toward the lower end of the projected range.
Earlier, analysts noted that The Graph had entered a bullish phase supported by positive technical signals and trending above key moving averages. The current analysis signals a notable shift to sustained downside momentum, making the $0.02332 support level critical for traders monitoring potential further declines in the days ahead.











-
 Afghanistan
-
 Albania
-
 Algeria
-
 Angola
-
 Argentina
-
 Armenia
-
 Australia
-
 Austria
-
 Azerbaijan
-
 Bahamas
-
 Bahrain
-
 Bangladesh
-
 Belarus
-
 Belgium
-
 Bolivia
-
 Botswana
-
 Brazil
-
 Brunei
-
 Bulgaria
-
 Cambodia
-
 Cameroon
-
 Canada
-
 Chile
-
 China
-
 Colombia
-
 Congo
-
 Costa Rica
-
 Cote d'Ivoire
-
 Croatia
-
 Cuba
-
 Cyprus
-
 Czechia
-
 DR Congo
-
 Denmark
-
 Dominican Republic
-
 Ecuador
-
 Egypt
-
 El Salvador
-
 Estonia
-
 Eswatini
-
 Ethiopia
-
 Finland
-
 France
-
 Georgia
-
 Germany
-
 Ghana
-
 Greece
-
 Haiti
-
 Hong Kong
-
 Hungary
-
 India
-
 Indonesia
-
 Iran, Islamic republic
-
 Iraq
-
 Ireland
-
 Israel
-
 Italy
-
 Jamaica
-
 Japan
-
 Jordan
-
 Kazakhstan
-
 Kenya
-
 Korea
-
 Kuwait
-
 Kyrgyzstan
-
 Laos
-
 Latvia
-
 Lebanon
-
 Lesotho
-
 Libya
-
 Lithuania
-
 Luxembourg
-
 Madagascar
-
 Malaysia
-
 Malta
-
 Mauritius
-
 Mexico
-
 Moldova
-
 Mongolia
-
 Montenegro
-
 Morocco
-
 Mozambique
-
 Myanmar
-
 Namibia
-
 Nepal
-
 Netherlands
-
 New Zealand
-
 Nigeria
-
 North Macedonia
-
 Norway
-
 Oman
-
 Pakistan
-
 Palestine
-
 Panama
-
 Papua New Guinea
-
 Paraguay
-
 Peru
-
 Philippines
-
 Poland
-
 Portugal
-
 Puerto Rico
-
 Qatar
-
 Reunion
-
 Romania
-
 Rwanda
-
 Saudi Arabia
-
 Serbia
-
 Singapore
-
 Slovakia
-
 Slovenia
-
 Somalia
-
 South Africa
-
 Spain
-
 Sri Lanka
-
 Sweden
-
 Switzerland
-
 Syria
-
 Taiwan
-
 Tajikistan
-
 Tanzania
-
 Thailand
-
 Trinidad and Tobago
-
 Tunisia
-
 Turkey
-
 UAE
-
 Uganda
-
 Ukraine
-
 United Kingdom
-
United States
-
 Uruguay
-
 Uzbekistan
-
 Venezuela
-
 Vietnam
-
 Yemen
-
 Zambia
-
 Zimbabwe
- Forex
- Crypto












