

The Graph price prediction: Momentum builds as buyers keep price above support

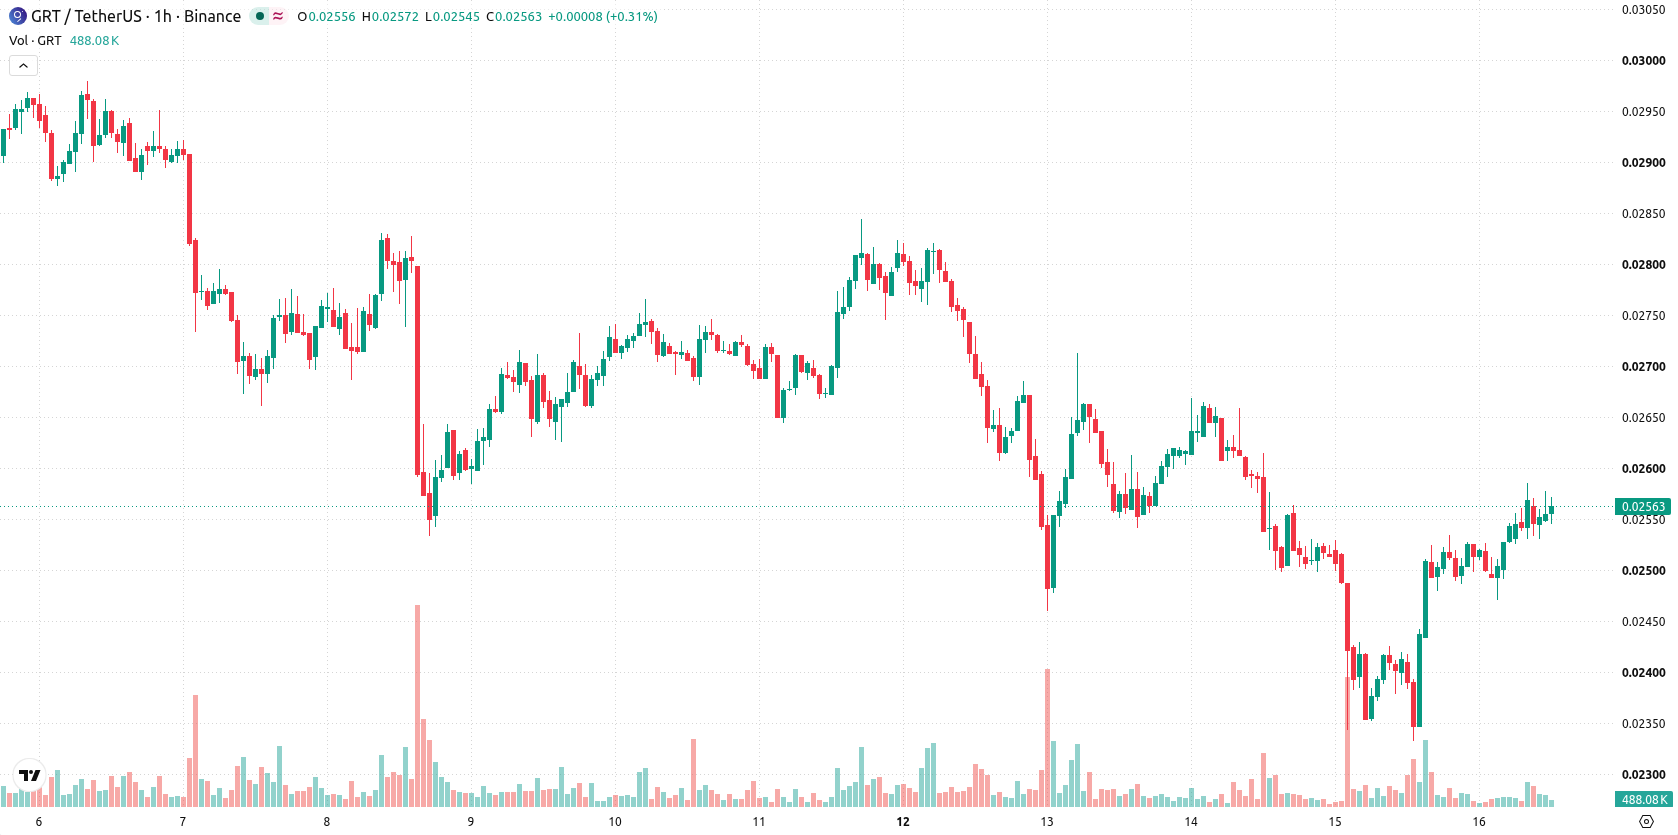
The Graph (GRT) is trading at $0.02571 after a 7.26% gain over the last session, with price sitting above its key moving averages.
 0.02443
0.02821000
0.02443
0.02821000
Highlights
- GRT/USD trades in a short- and medium-term bullish trend with long-term support holding firmly.
- Momentum indicators are mostly positive with modest bullish momentum and buyers in control, but CCI reads overbought.
- Price surged 7.26% to $0.02571, with a projected 2 to 3 session range of $0.02456513 to $0.02685487 and a 71% probability of upward movement.
Bullish signals sustained as technical indicators confirm overbought trend
On the h1 timeframe, GRT is positioned above the MA-20 ($0.0252335) and MA-50 ($0.0249182), while also remaining well above the daily MA-200 ($0.0212485). The Ichimoku Kijun at $0.024585 acts as immediate support. MACD is signaling Buy, ADX is neutral, and both RSI at 60 and Stochastic RSI generating Buy signals indicate a continuation of modest bullish momentum. Commodity Channel Index stands in Overbought territory, suggesting stretched near-term conditions, and Bull/Bear Power confirms buyers’ control. The Awesome Oscillator is aligned with the current upward price action, reinforcing the prevailing trend.
Upside potential increases as consolidation or breakout scenarios develop
Looking ahead to the next 2–3 sessions, the expected trading range is $0.02456513 to $0.02685487. There is a 71% probability of an upside move, while the chance of a pullback remains notably lower. If GRT consolidates within this range, a period of sideways movement may occur; a breakout above resistance would target new highs, whereas a loss of support could accelerate a downward correction.
In a recent review, The Graph was described as being under persistent downside pressure amid unfavorable technical signals and limited short-term upside prospects. With the current shift to bullish momentum and key moving averages now supporting the trend, traders should closely monitor for a sustained breakout above resistance, as this could open the door to further gains.











-
 Afghanistan
-
 Albania
-
 Algeria
-
 Angola
-
 Argentina
-
 Armenia
-
 Australia
-
 Austria
-
 Azerbaijan
-
 Bahamas
-
 Bahrain
-
 Bangladesh
-
 Belarus
-
 Belgium
-
 Bolivia
-
 Botswana
-
 Brazil
-
 Brunei
-
 Bulgaria
-
 Cambodia
-
 Cameroon
-
 Canada
-
 Chile
Chile
-
 China
China
-
 Colombia
-
 Congo
Congo
-
 Costa Rica
-
 Cote d'Ivoire
-
 Croatia
-
 Cuba
Cuba
-
 Cyprus
-
 Czechia
-
 DR Congo
-
 Denmark
-
 Dominican Republic
-
 Ecuador
-
 Egypt
Egypt
-
 El Salvador
-
 Estonia
-
 Eswatini
-
 Ethiopia
-
 Finland
-
 France
-
 Georgia
-
 Germany
-
 Ghana
Ghana
-
 Greece
-
 Haiti
Haiti
-
 Hong Kong
-
 Hungary
-
 India
India
-
 Indonesia
-
 Iran, Islamic republic
-
 Iraq
Iraq
-
 Ireland
-
 Israel
-
 Italy
Italy
-
 Jamaica
-
 Japan
Japan
-
 Jordan
-
 Kazakhstan
-
 Kenya
Kenya
-
 Korea
Korea
-
 Kuwait
-
 Kyrgyzstan
-
 Laos
Laos
-
 Latvia
-
 Lebanon
-
 Lesotho
-
 Libya
Libya
-
 Lithuania
-
 Luxembourg
-
 Madagascar
-
 Malaysia
-
 Malta
Malta
-
 Mauritius
-
 Mexico
-
 Moldova
-
 Mongolia
-
 Montenegro
-
 Morocco
-
 Mozambique
-
 Myanmar
-
 Namibia
-
 Nepal
Nepal
-
 Netherlands
-
 New Zealand
-
 Nigeria
-
 North Macedonia
-
 Norway
-
 Oman
Oman
-
 Pakistan
-
 Palestine
-
 Panama
-
 Papua New Guinea
-
 Paraguay
-
 Peru
Peru
-
 Philippines
-
 Poland
-
 Portugal
-
 Puerto Rico
-
 Qatar
Qatar
-
 Reunion
-
 Romania
-
 Rwanda
-
 Saudi Arabia
-
 Serbia
-
 Singapore
-
 Slovakia
-
 Slovenia
-
 Somalia
-
 South Africa
-
 Spain
Spain
-
 Sri Lanka
-
 Sweden
-
 Switzerland
-
 Syria
Syria
-
 Taiwan
-
 Tajikistan
-
 Tanzania
-
 Thailand
-
 Trinidad and Tobago
-
 Tunisia
-
 Turkey
-
 UAE
UAE
-
 Uganda
-
 Ukraine
-
 United Kingdom
-
United States
-
 Uruguay
-
 Uzbekistan
-
 Venezuela
-
 Vietnam
-
 Yemen
Yemen
-
 Zambia
-
 Zimbabwe
- Forex
- Crypto












